
After the match
Following players across the season
Available on every plan
A match report tells you how one player did on one afternoon. Over a season you want something else: is your left back scoring more than in the fall, is your second goalkeeper getting enough minutes, and did that rough patch last month have anything to do with one player in particular? Every player has a page of their own that answers those questions, over whichever stretch of the season you choose.
For the whole team over a period, see Reports and export. This page is about one player at a time.
Finding a player's page
There are four ways in, so you can get there from wherever the question comes up:
- The statistics tab. Tap the top scorer or the top goalkeeper on their cards.
- Match statistics. Tap a name in the player table.
- Manage players. Press and hold a player and choose Player statistics.
- Team performance of a match (Pro). Tap a player and then Player statistics, to read one match against the rest of the season.
The player page
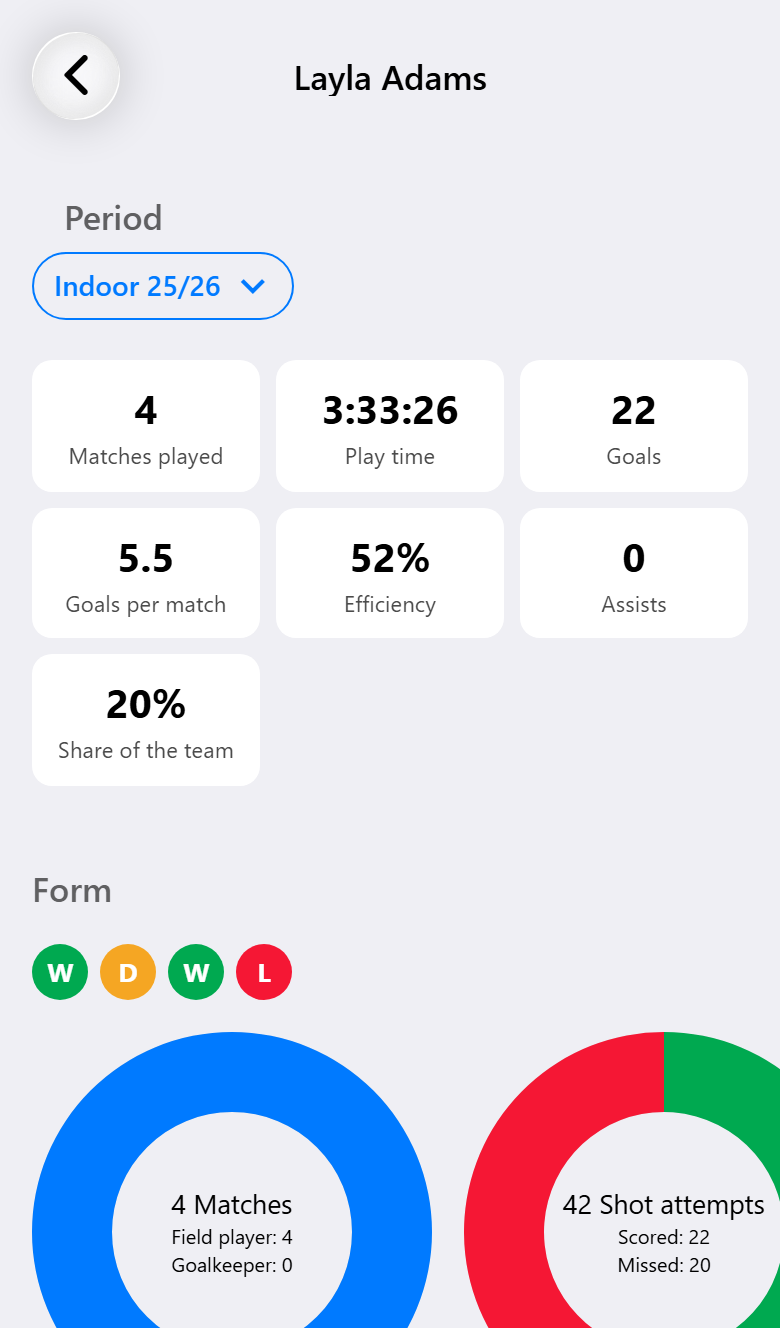
The page opens on the totals for the selected period:
- Matches played. Matches in which the player was on court, as a field player or in goal.
- Play time. Their minutes on court, all matches together.
- Goals and goals per match, worked out over the matches they played.
- Efficiency. How many of their shots went in.
- Assists.
- Share of the team. Their goals as a part of everything the team scored. Useful for spotting a team that leans on one player.
Form
Under the totals is the player's form: the results of the last ten matches they were part of, most recent on the left. Green is a win, orange a draw, red a loss. Tap a letter to open the report of that match.
Form is the team's result, not a rating of the player. It is there to put their numbers in context: a quiet match in a heavy defeat reads differently from a quiet match in a win.
The rings
Below the form is a row of rings that you swipe sideways: how often the player played on court and how often in goal, their shots scored and missed, their 7-meter throws, how often they were present, injured or absent, and their cards and suspensions. The 7-meter and card rings only show up when there is something to count.
Defensive impact
Below the statistics is what the opponent managed while this player was defending, next to the time they sat on the bench: goals conceded per 10 minutes, the opponent's shooting percentage and the opponent's ball losses. The player's own defensive actions are listed below it. Only the time as a field player counts.
Over one match this says little, over a period much more, because all matches are added up before anything is compared. With at least 20% of the time on court and 20% on the bench, the page also shows how many fewer goals per 10 minutes the team conceded with this player on. The match statistics show that figure as a column, so you can find the best defender of the period. The same figures for one match are in a player's performance.
Choosing the period
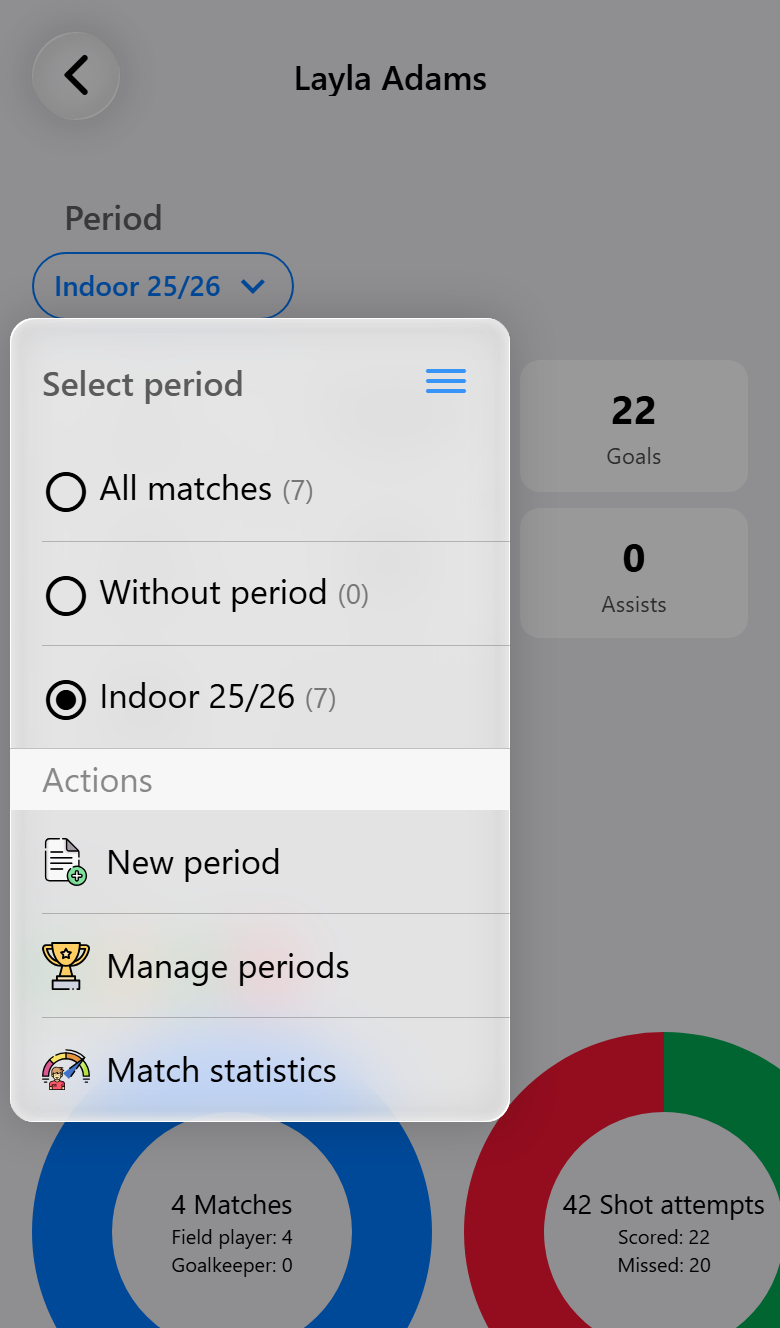
The button at the top says which period you are looking at. Tap it to choose another one, or All matches for every match the team has played. The number behind each period is how many matches it holds.
To combine periods, tap the button with the three lines and switch on the ones you want. That way an indoor and an outdoor season can be read as one year.
The choice is the same one the rest of the app uses. Pick a period here and the statistics tab and match statistics switch to it as well, so you do not lose track of which numbers you are comparing.
Adding a period needs Pro, and is explained under Multiple teams and periods. Without one, All matches covers the whole season.
Match by match
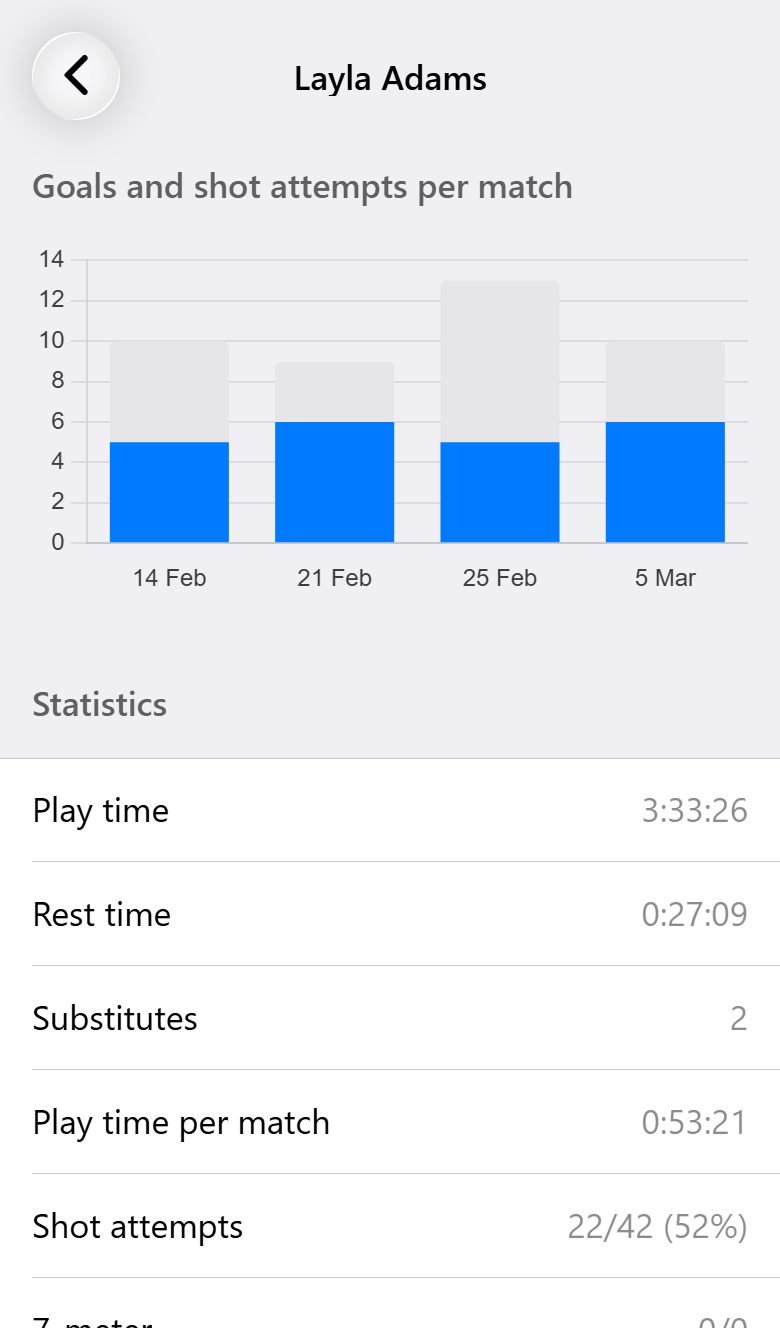
Goals and shot attempts per match shows the season as it went, oldest match on the left. The blue part of a bar is the player's goals, the gray part the shots that did not go in, so the full bar is everything they took. A bar that grows while its blue part stays the same is a player who keeps shooting without the ball going in.
Under the chart is every number the app holds about the player for the period: play time and rest time, substitutions, shots, 7-meters, fast breaks, assists, 7-meters earned and caused, turnovers, interceptions, blocks, cards and suspensions. A player who has stood in goal also gets their time as goalkeeper, their saves and the 7-meters they stopped.
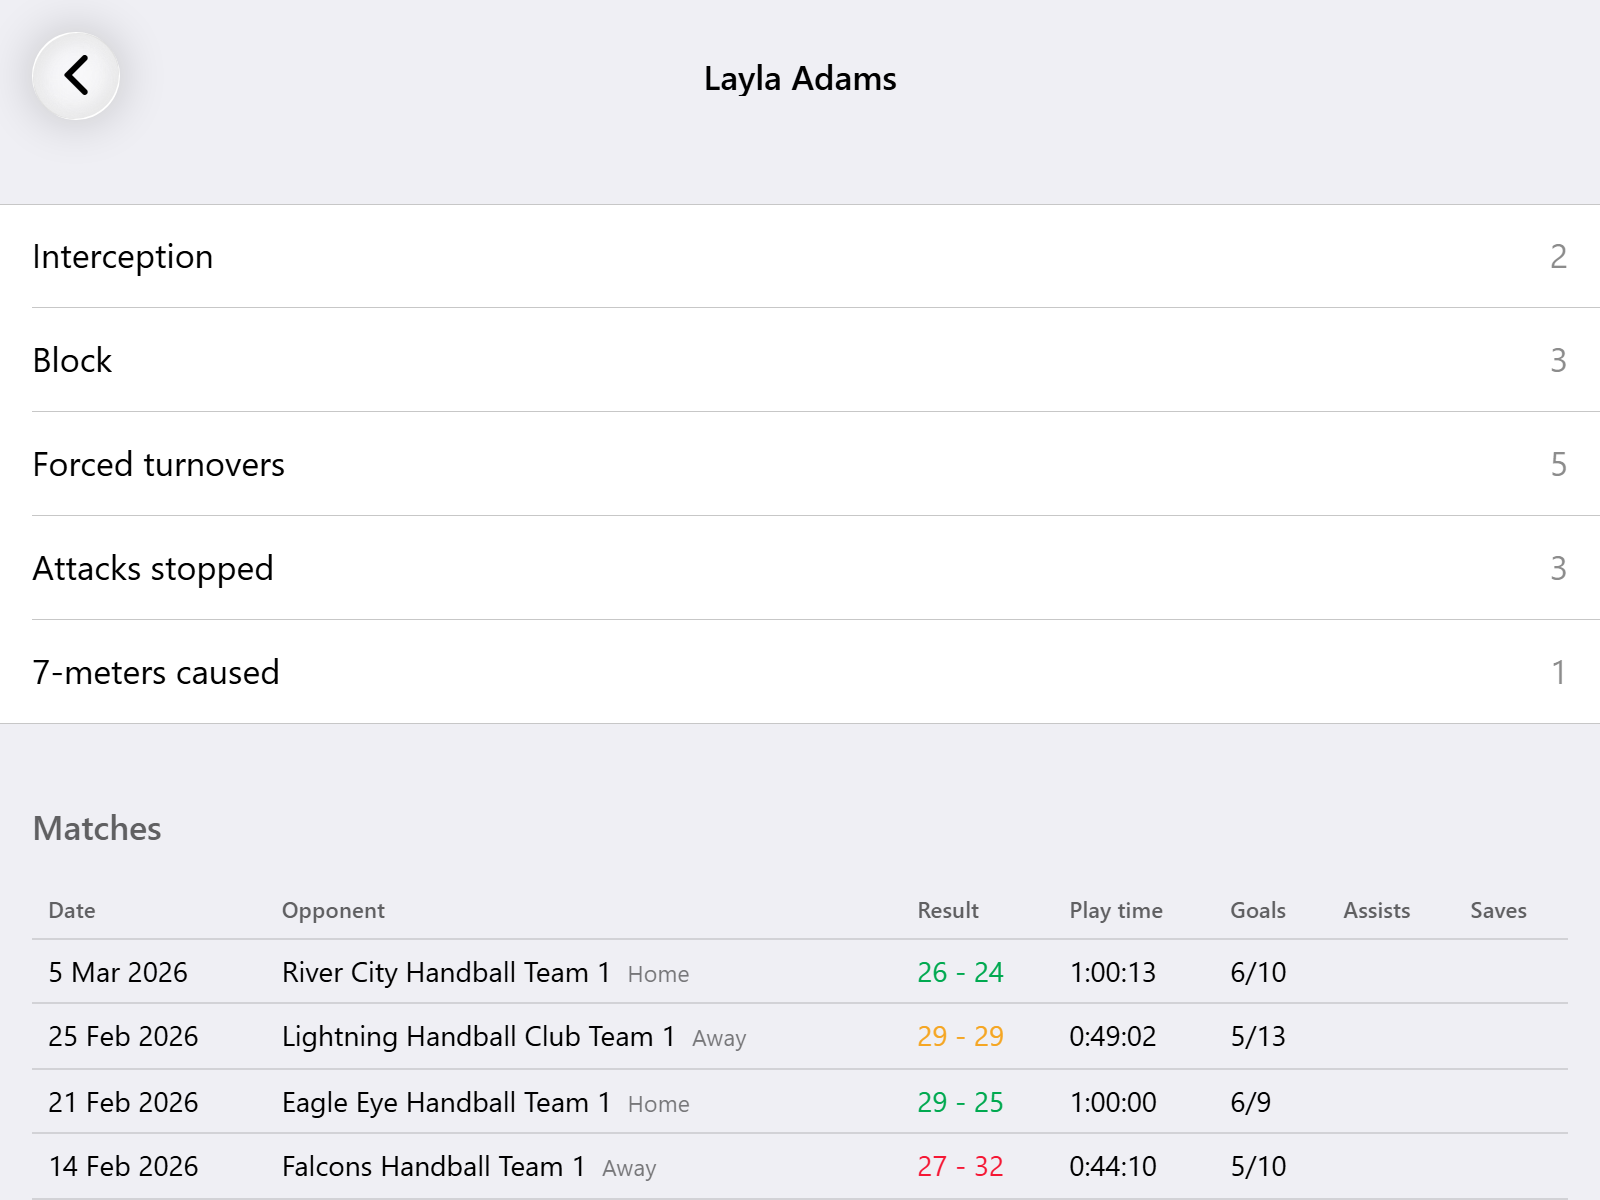
At the bottom, Matches lists every match one by one: the date, the opponent and whether it was at home or away, the result, the player's play time, goals out of attempts, assists and saves. Tap a row to open the report of that match. The table is wider than a phone, so swipe it sideways for the last columns.
What gets counted
The page counts finished matches only, so a match still being played does not pull the averages down halfway through. A match someone shared with you is left out too.
Fast breaks, turnovers, interceptions and blocks are only registered with Max, so on Base and Pro those rows stay at zero. The same goes for shots: a player's efficiency is only as good as the shots that were registered for them. See Everything you can record.
What you need for what
| Base | Pro | Max | |
|---|---|---|---|
| A page per player, over any period | ✓ | ✓ | ✓ |
| Form, rings and goals per match | ✓ | ✓ | ✓ |
| Every match of a player, each opening its report | ✓ | ✓ | ✓ |
| Top scorer and top goalkeeper on the statistics tab | ✓ | ✓ | ✓ |
| Opening a player from the team performance of a match | ✓ | ✓ | |
| Fast breaks, turnovers, interceptions and blocks on the page | ✓ |