
After the match
Advanced statistics
Available onMax
The report in the app answers what happened in a match. The statistics website answers why, and what a run of matches says that a single one cannot. It is a separate website, made for a laptop or a tablet, where every match you recorded can be taken apart: by phase of play, by player, by minute, by where the shots came from.
It needs Max, and it is only as rich as what was recorded. Shot attempts, turnovers and the rest of Everything you can record are what fill it.
Opening it
From the app, in two places:
- One match. Open its report and use the statistics card: View online opens it on this device and Share link sends it to someone else.
- A selection of matches. Open Match statistics, choose the periods you want, and use the same card there. The periods you chose decide which matches are in it.
A link works for anyone who has it, without an account, so it can go to an assistant, a club's technical committee or a parent. A shared link to a selection already shows the team, the number of matches and the results in the preview, before anyone opens it.
One match
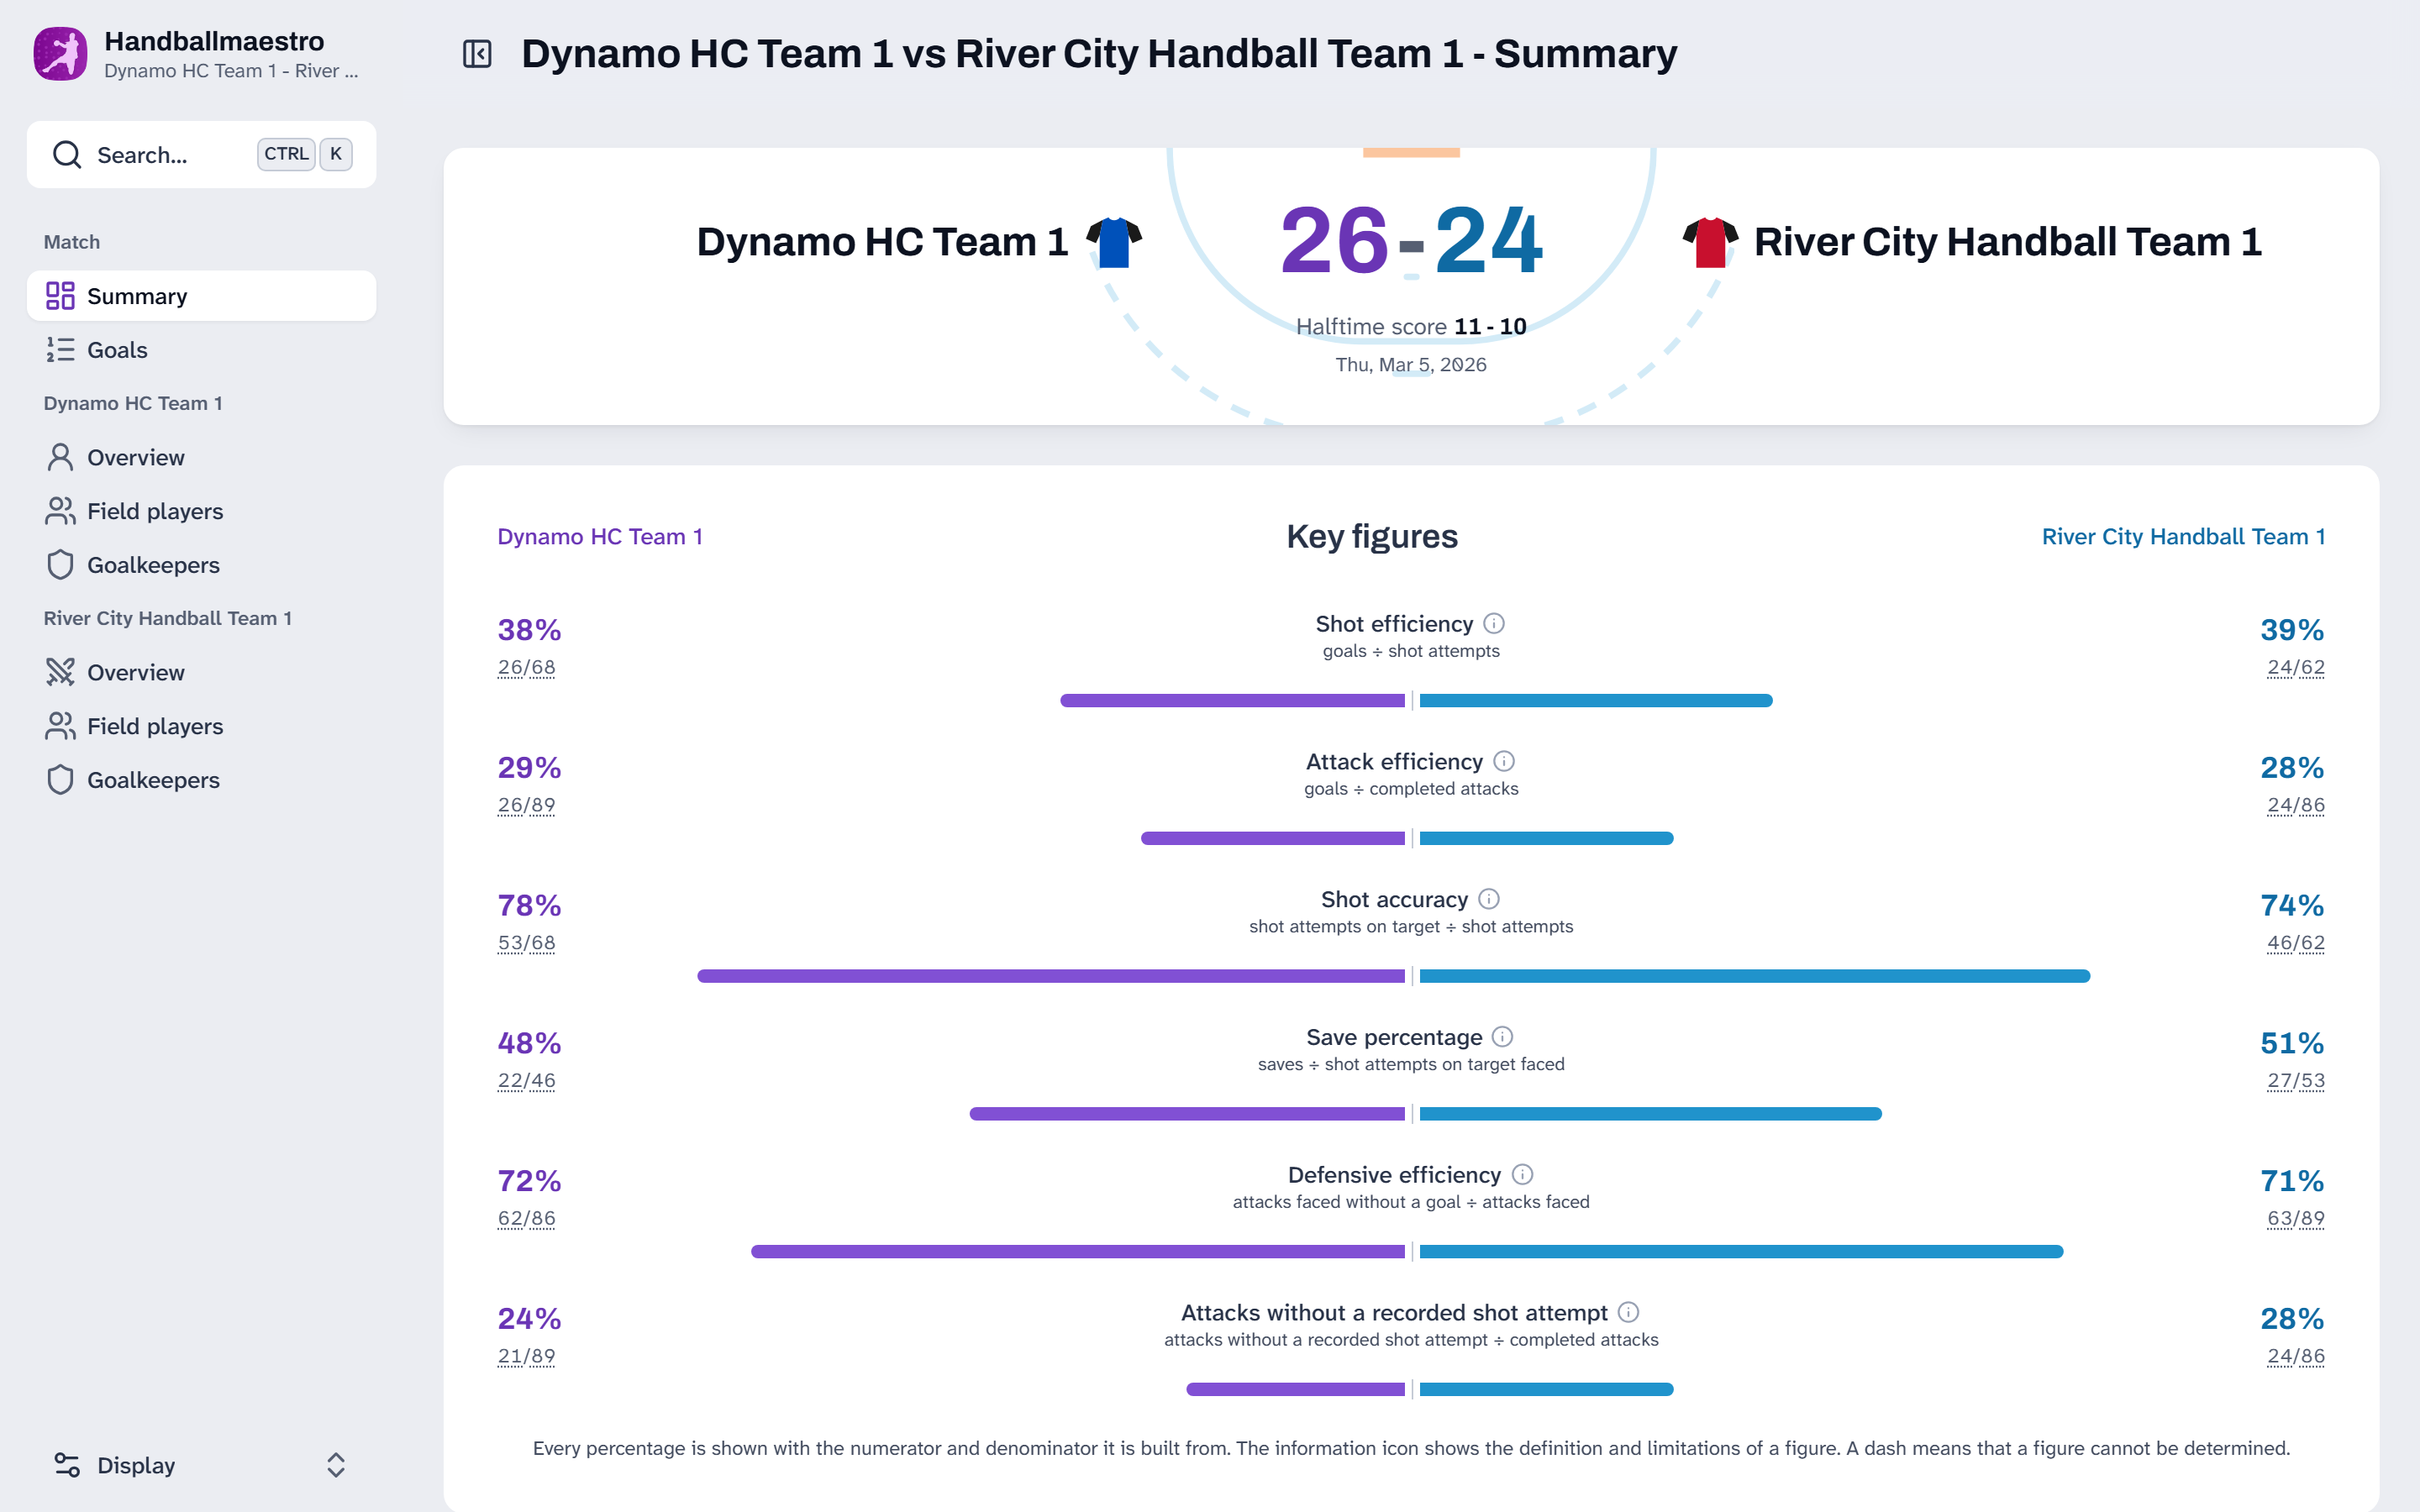
The summary puts both teams side by side on the figures that say most about a match:
- Shot efficiency: goals out of shot attempts.
- Attack efficiency: goals out of completed attacks, so turnovers count against it too.
- Shot accuracy: how many shots were on target.
- Save percentage and defensive efficiency: the same, seen from the other goal.
- Attacks without a recorded shot attempt: where the ball was lost before anyone shot.
Every percentage shows the two numbers it is built from, and the information icon says how it is calculated and where it falls short. The same page has the efficiency per phase of play, and the score at every interval next to the final score.
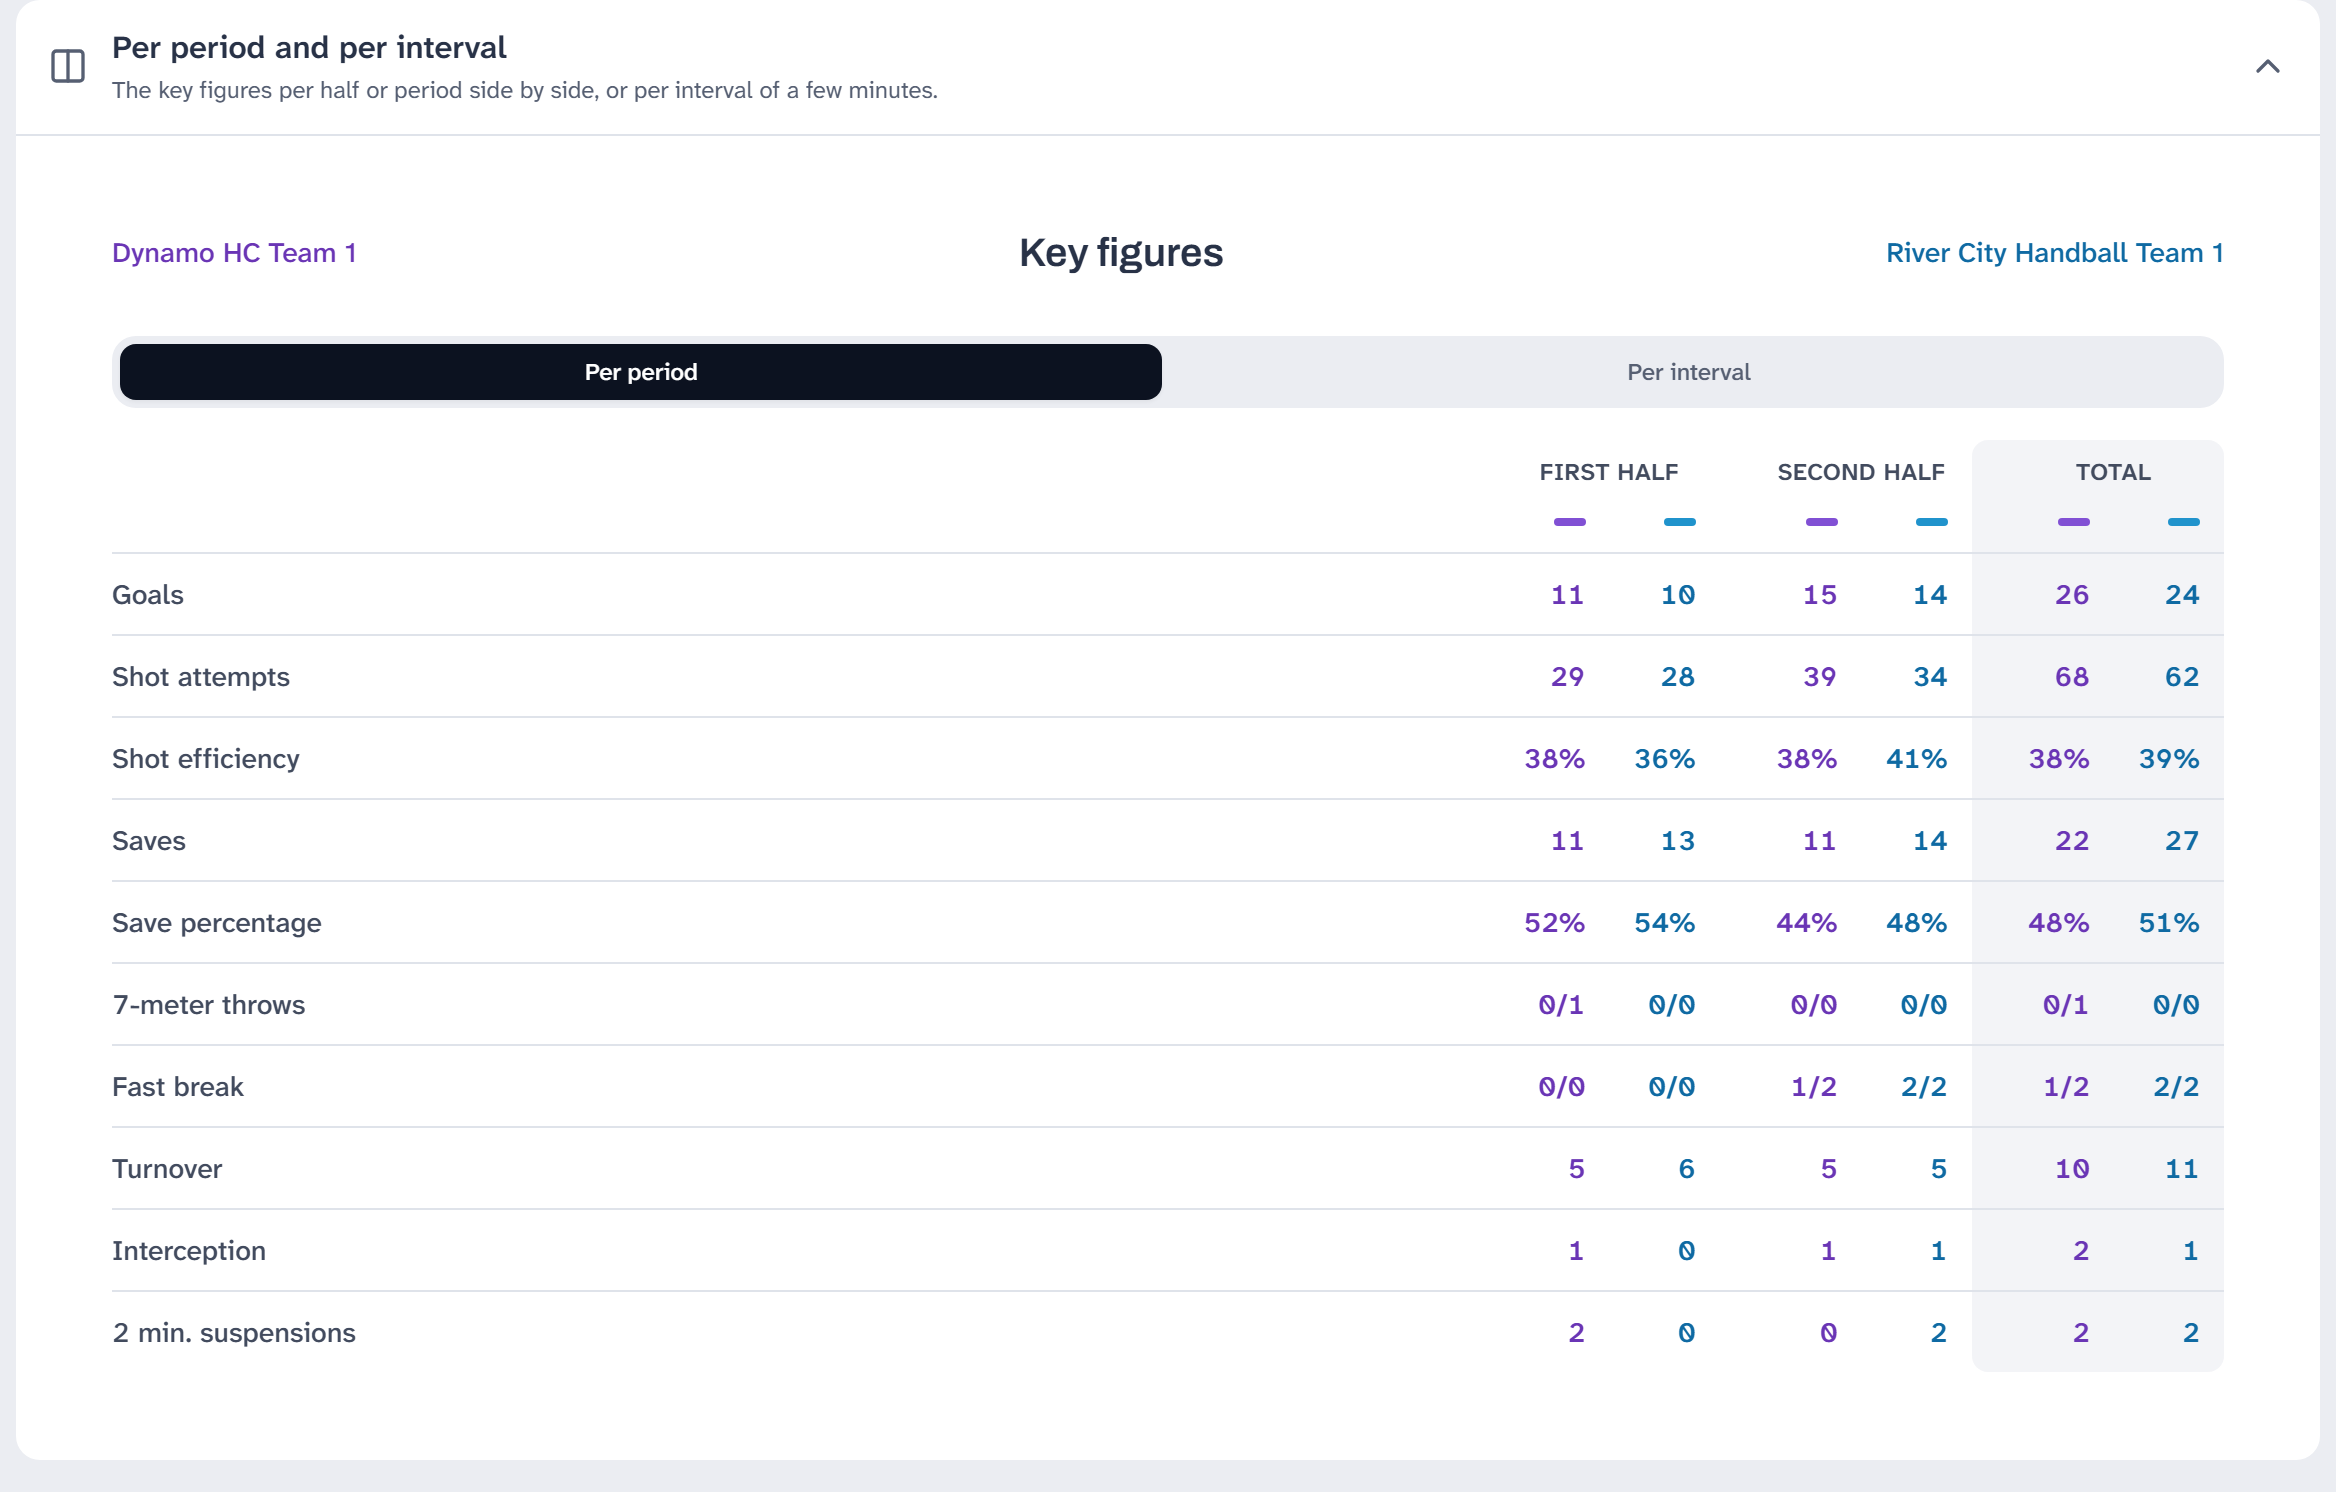
Under Per period and per interval, the key figures per half or period stand side by side, followed by the whole match, so you can see how many shot attempts were taken in the first half against the second. Per interval reads the same match in blocks of 5, 10 or 15 minutes. They are the same figures as in the key figures panel of the coach dashboard.
Next to the summary are the goals in order, with the score as it went. Under it the side menu has the same three items for both teams, each under the team's name: Overview, Field players and Goalkeepers. The overview of your own team is the squad: every player as a card, the standouts first. A click on one of your players anywhere on the website opens their page, with their playing time, plus-minus, share in the team's production, key figures, where they shot from and every action. The buttons at the top narrow it to a half or a block of minutes.
You can see who your best defender is without recording anything extra. Under Defensive impact the player page shows the goals conceded per 10 minutes, the opponent's shooting percentage and the opponent's ball losses, with the player on the court next to the time on the bench. Only the time as a field player counts: a goalkeeper is judged on their saves. The standouts include the best defender: the player with whom the team conceded the fewest goals per 10 minutes compared to the time without them. That takes at least 20% of the time on the court and 20% on the bench. The figures also depend on teammates and the goalkeeper, so over one match they are a hint and over a series of matches they become reliable. Without tracked substitutions there is nothing to compare against, and an explanation is shown instead of figures.
Field players and goalkeepers
Field players and Goalkeepers open on an Overview: a table of the whole line, with playing time, goals, shots and the rest, and a team total at the bottom. The tabs along the top read the same players in other ways:
- Scorers, for the field players: who scored, in a chart and a table.
- Actions: every action in a list, next to the shot map.
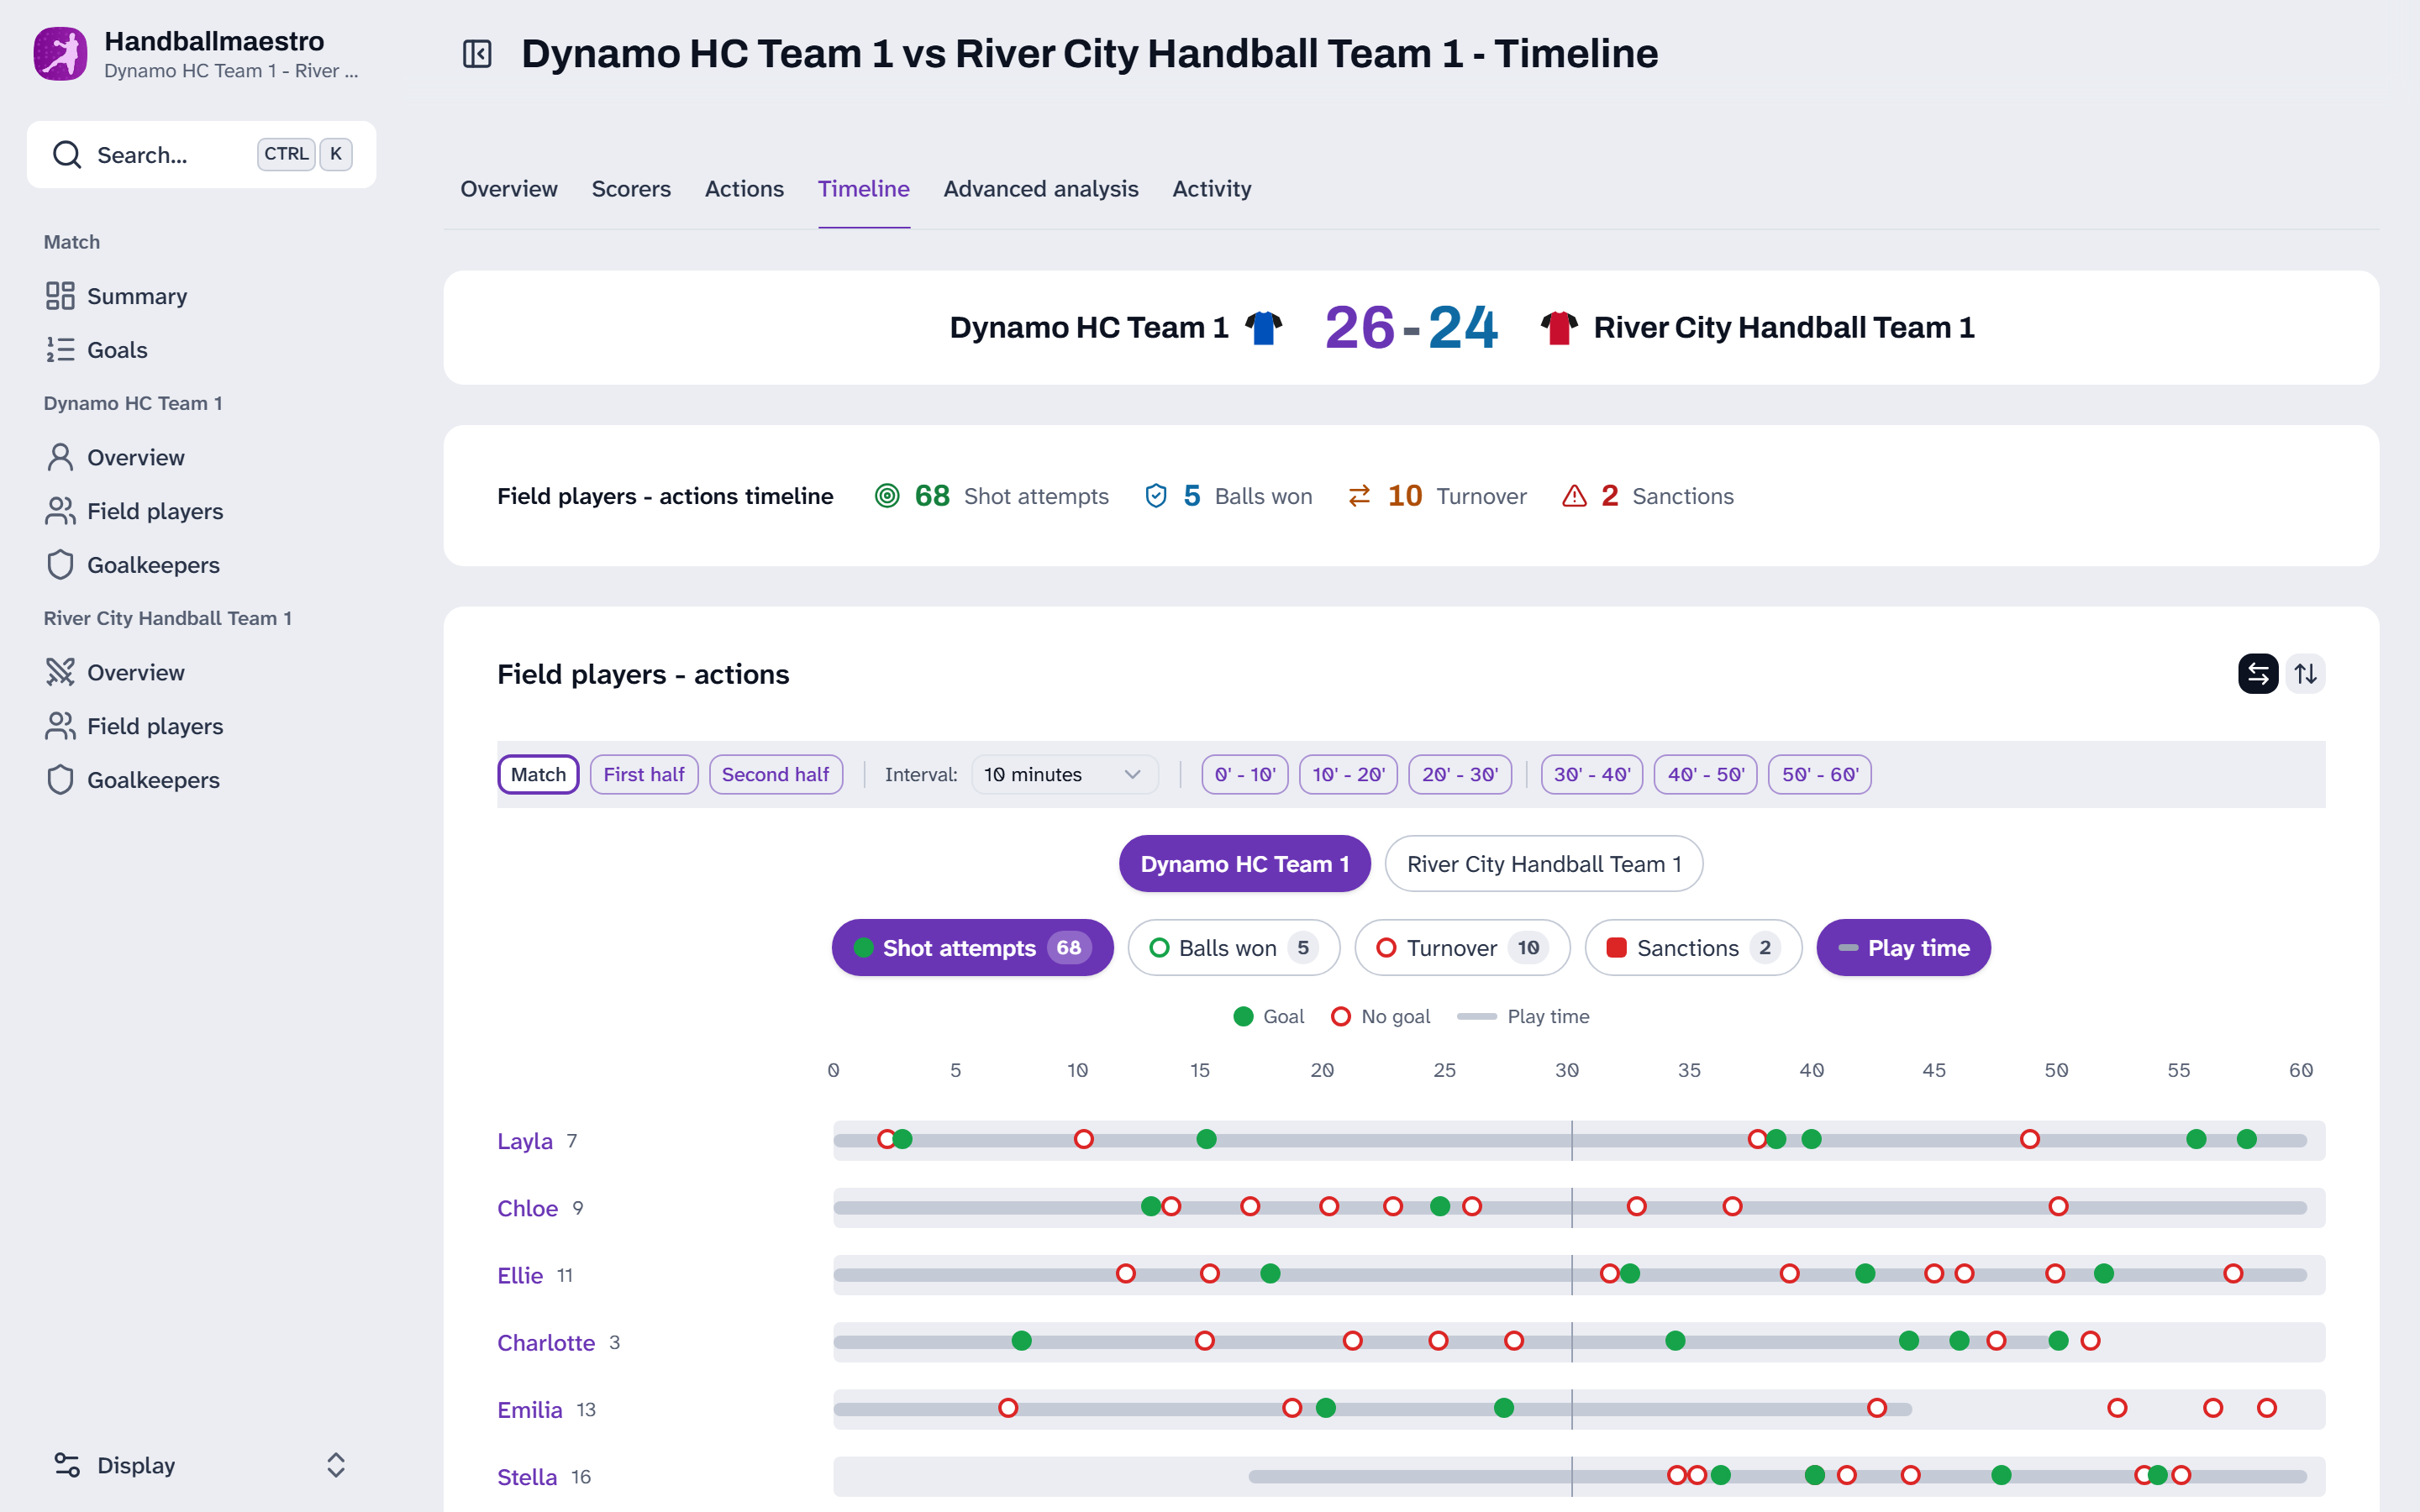
- Timeline: every player on one line across the match, with a dot for each shot attempt, ball won, turnover or sanction, and the stretches they were on the court. Switch to the opponent with the team buttons.
- Advanced analysis: the same list, taken apart by phase of play, kind of action and player.
- Activity: per player, what they did in attack and in defense. For field players, each side ends in a balance: what helped the team, such as goals or interceptions, against what cost it, such as turnovers or suspensions.
On every tab except the overview and the activity, the buttons at the top narrow it to a half or a block of minutes, so you can see what happened in the last ten minutes alone. The blocks start again with each period, so a block never holds the end of one half and the start of the next.
The opponent
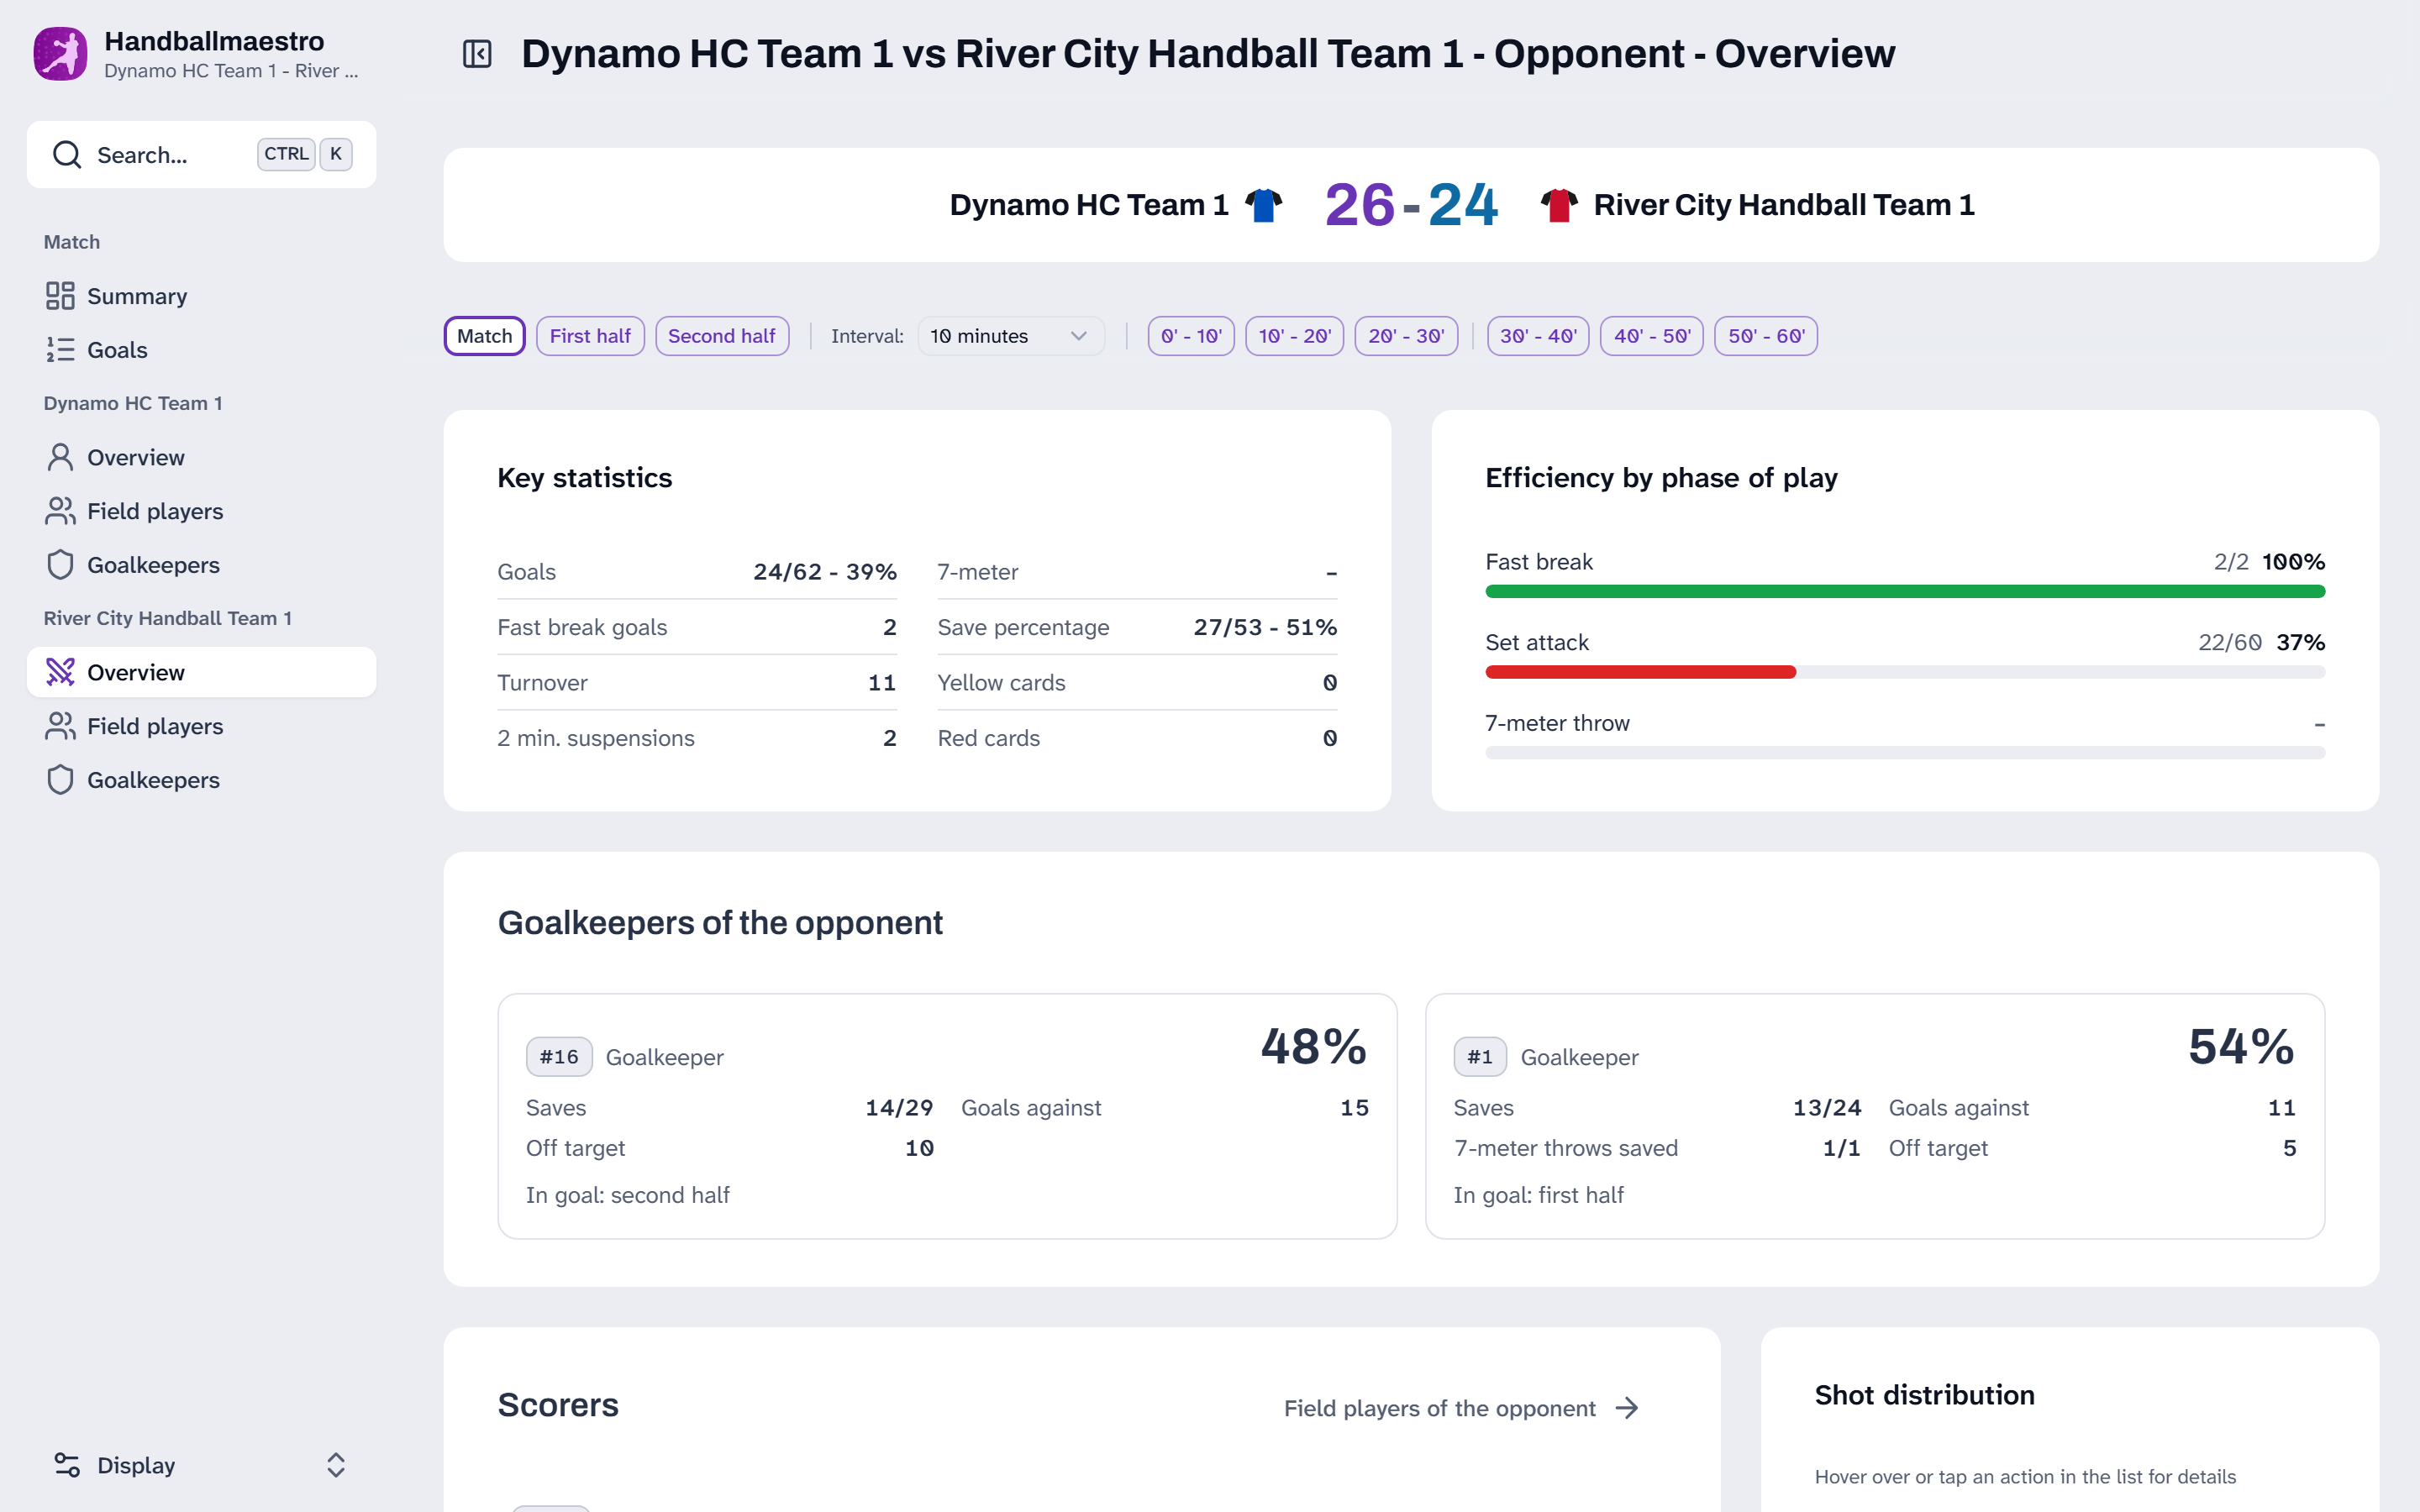
The opponent has the same three items, by jersey number, because that is all a match knows about them. The Overview shows their key figures, their efficiency per phase of play, their goalkeepers, their top scorers and where all their shots came from and went in. Field players lists every number with goals, penalties, assists, turnovers and cards. Goalkeepers shows the save percentage of each of their goalkeepers and the halves they were in goal, next to where your team's shots at them went. Both have an Actions tab with every action.
A click on a jersey number opens that player's page: their key figures, their actions and where they shot, or for a goalkeeper where your team's shots at them went. A half you choose stays chosen as you click through, so a goalkeeper who only kept the second half reads exactly that half. The link you share opens these pages for the other team too.
A selection of matches
This is where the website earns its place. Ten matches tell you things one match cannot.
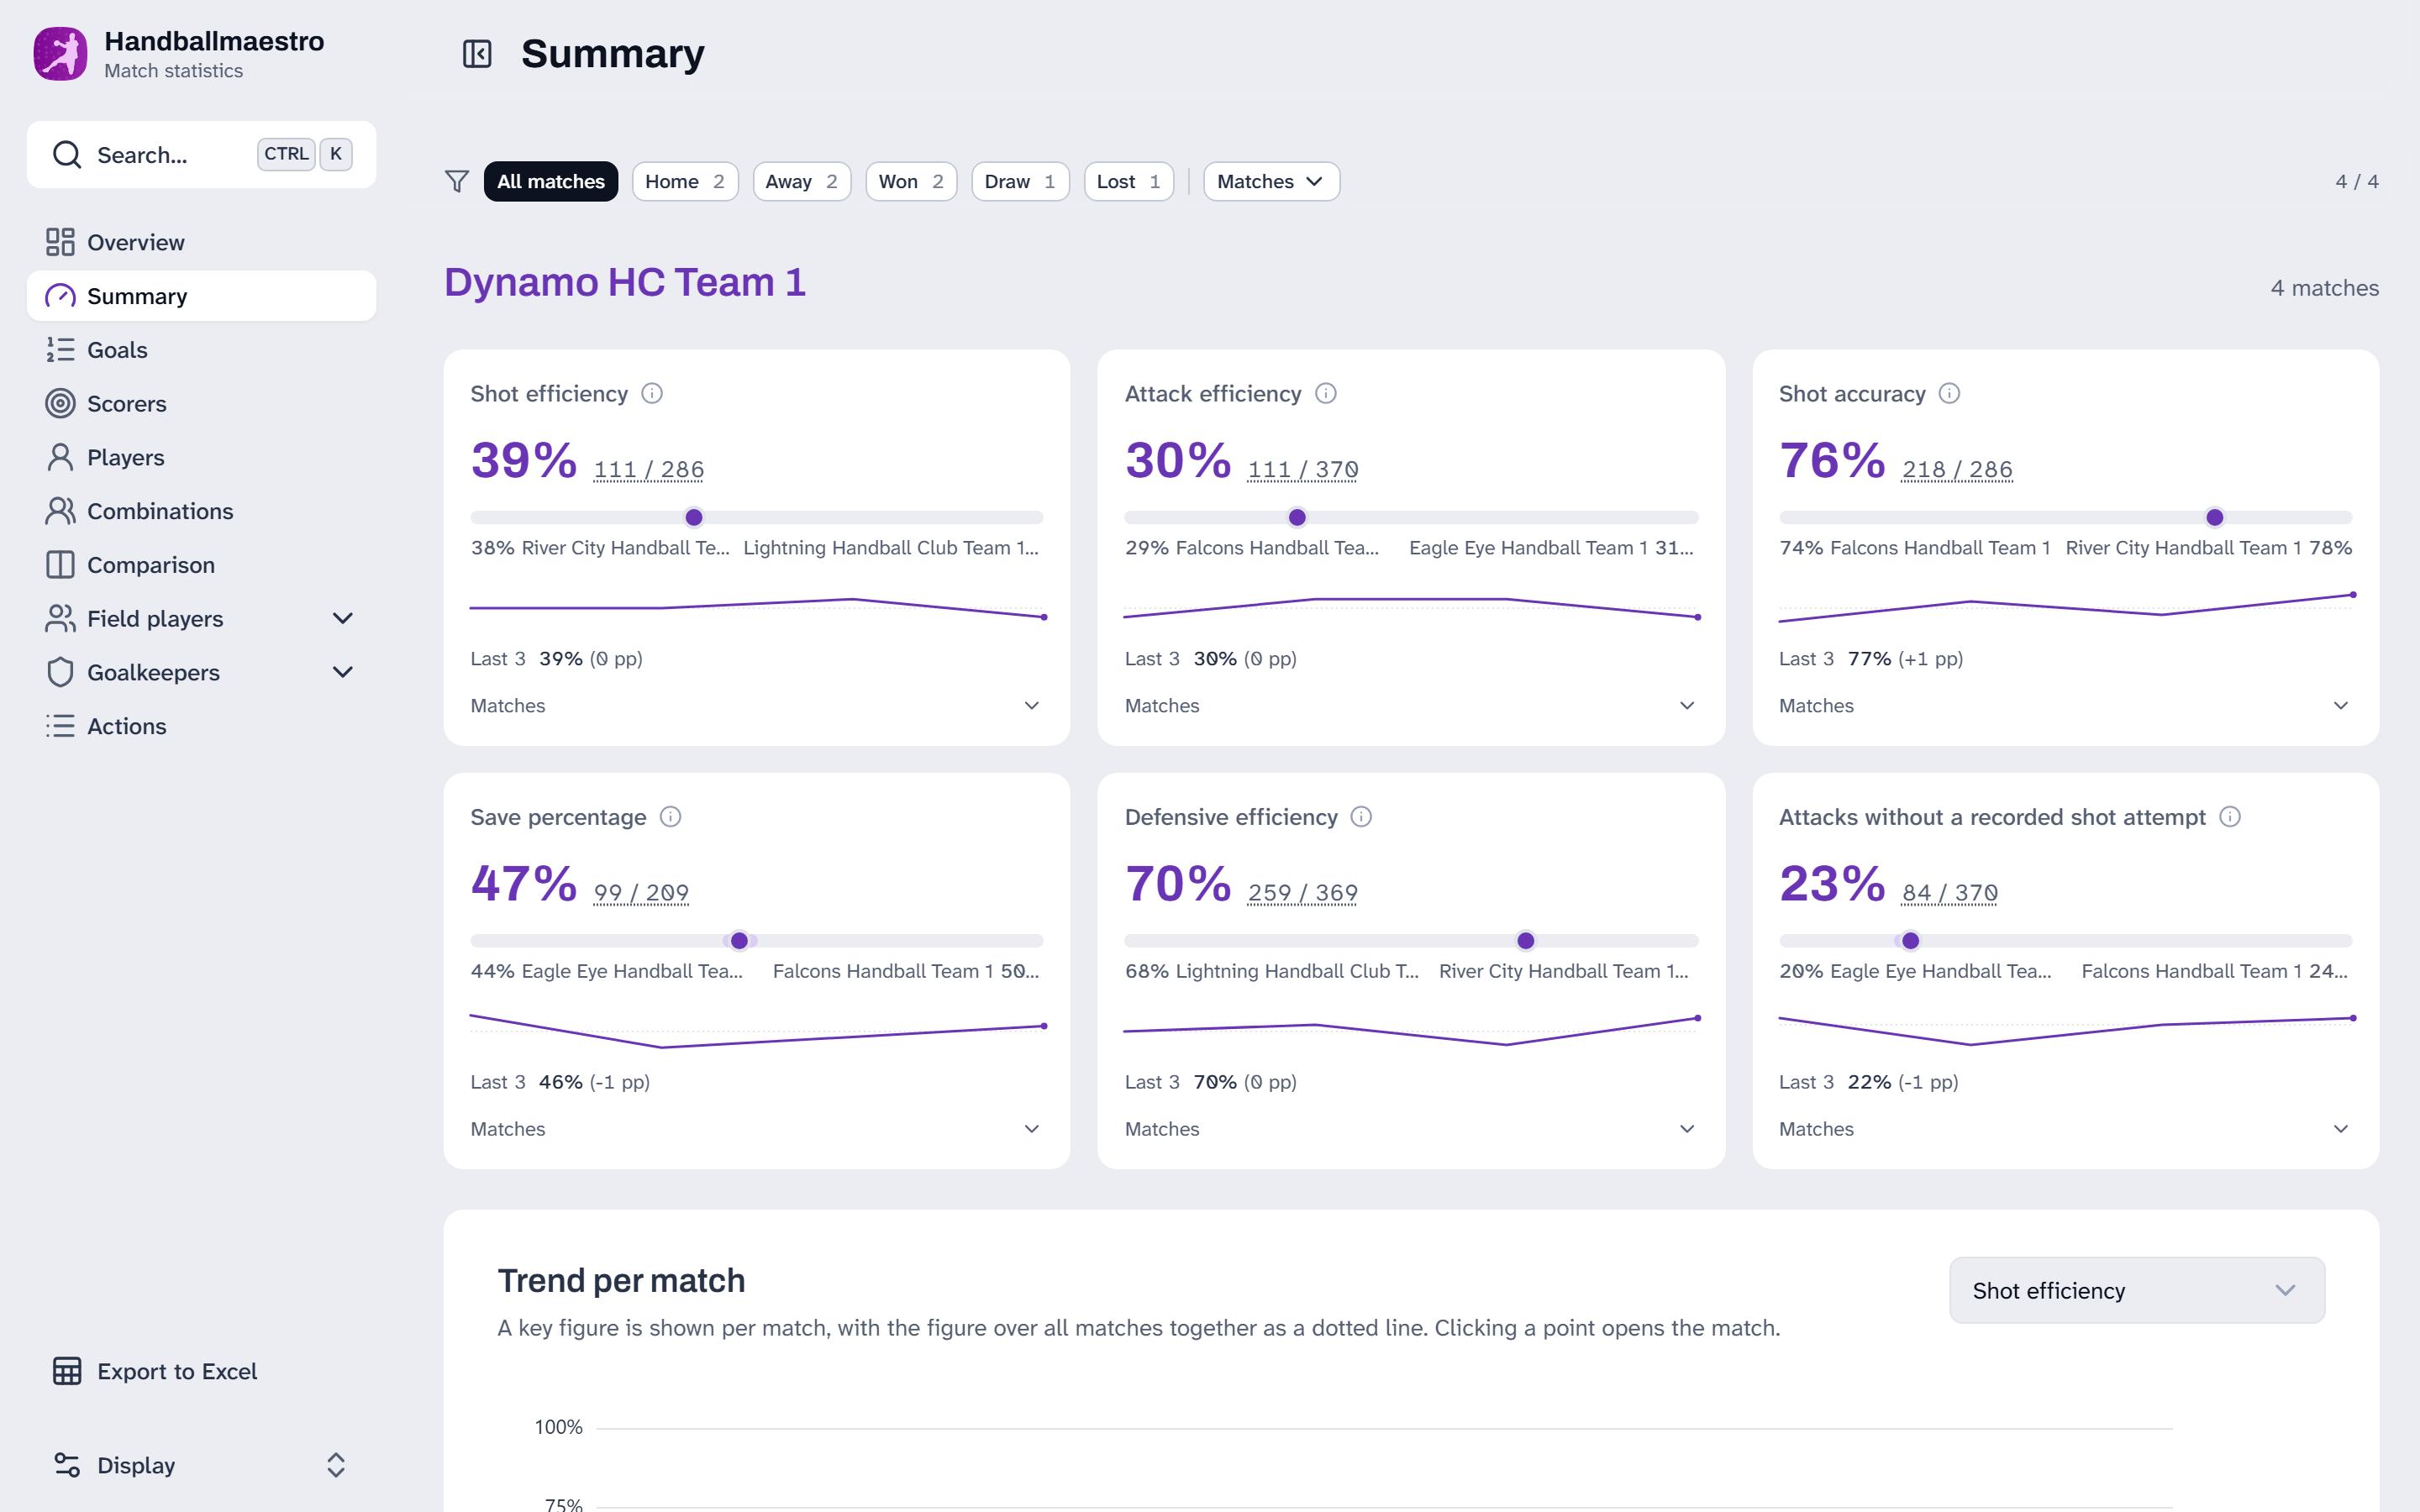
The summary shows the same key figures over all the matches together, with the range between the weakest and the strongest match, and how each figure moved from match to match. Open a figure and it splits into the matches it came from, each leading on to that match.
The bar at the top narrows the selection in one click: home or away, won, drawn or lost, a single opponent you played more than once, or any matches you pick. Every figure on every page is worked out again for what is left, and the link you share keeps the filter.
When the goals fall
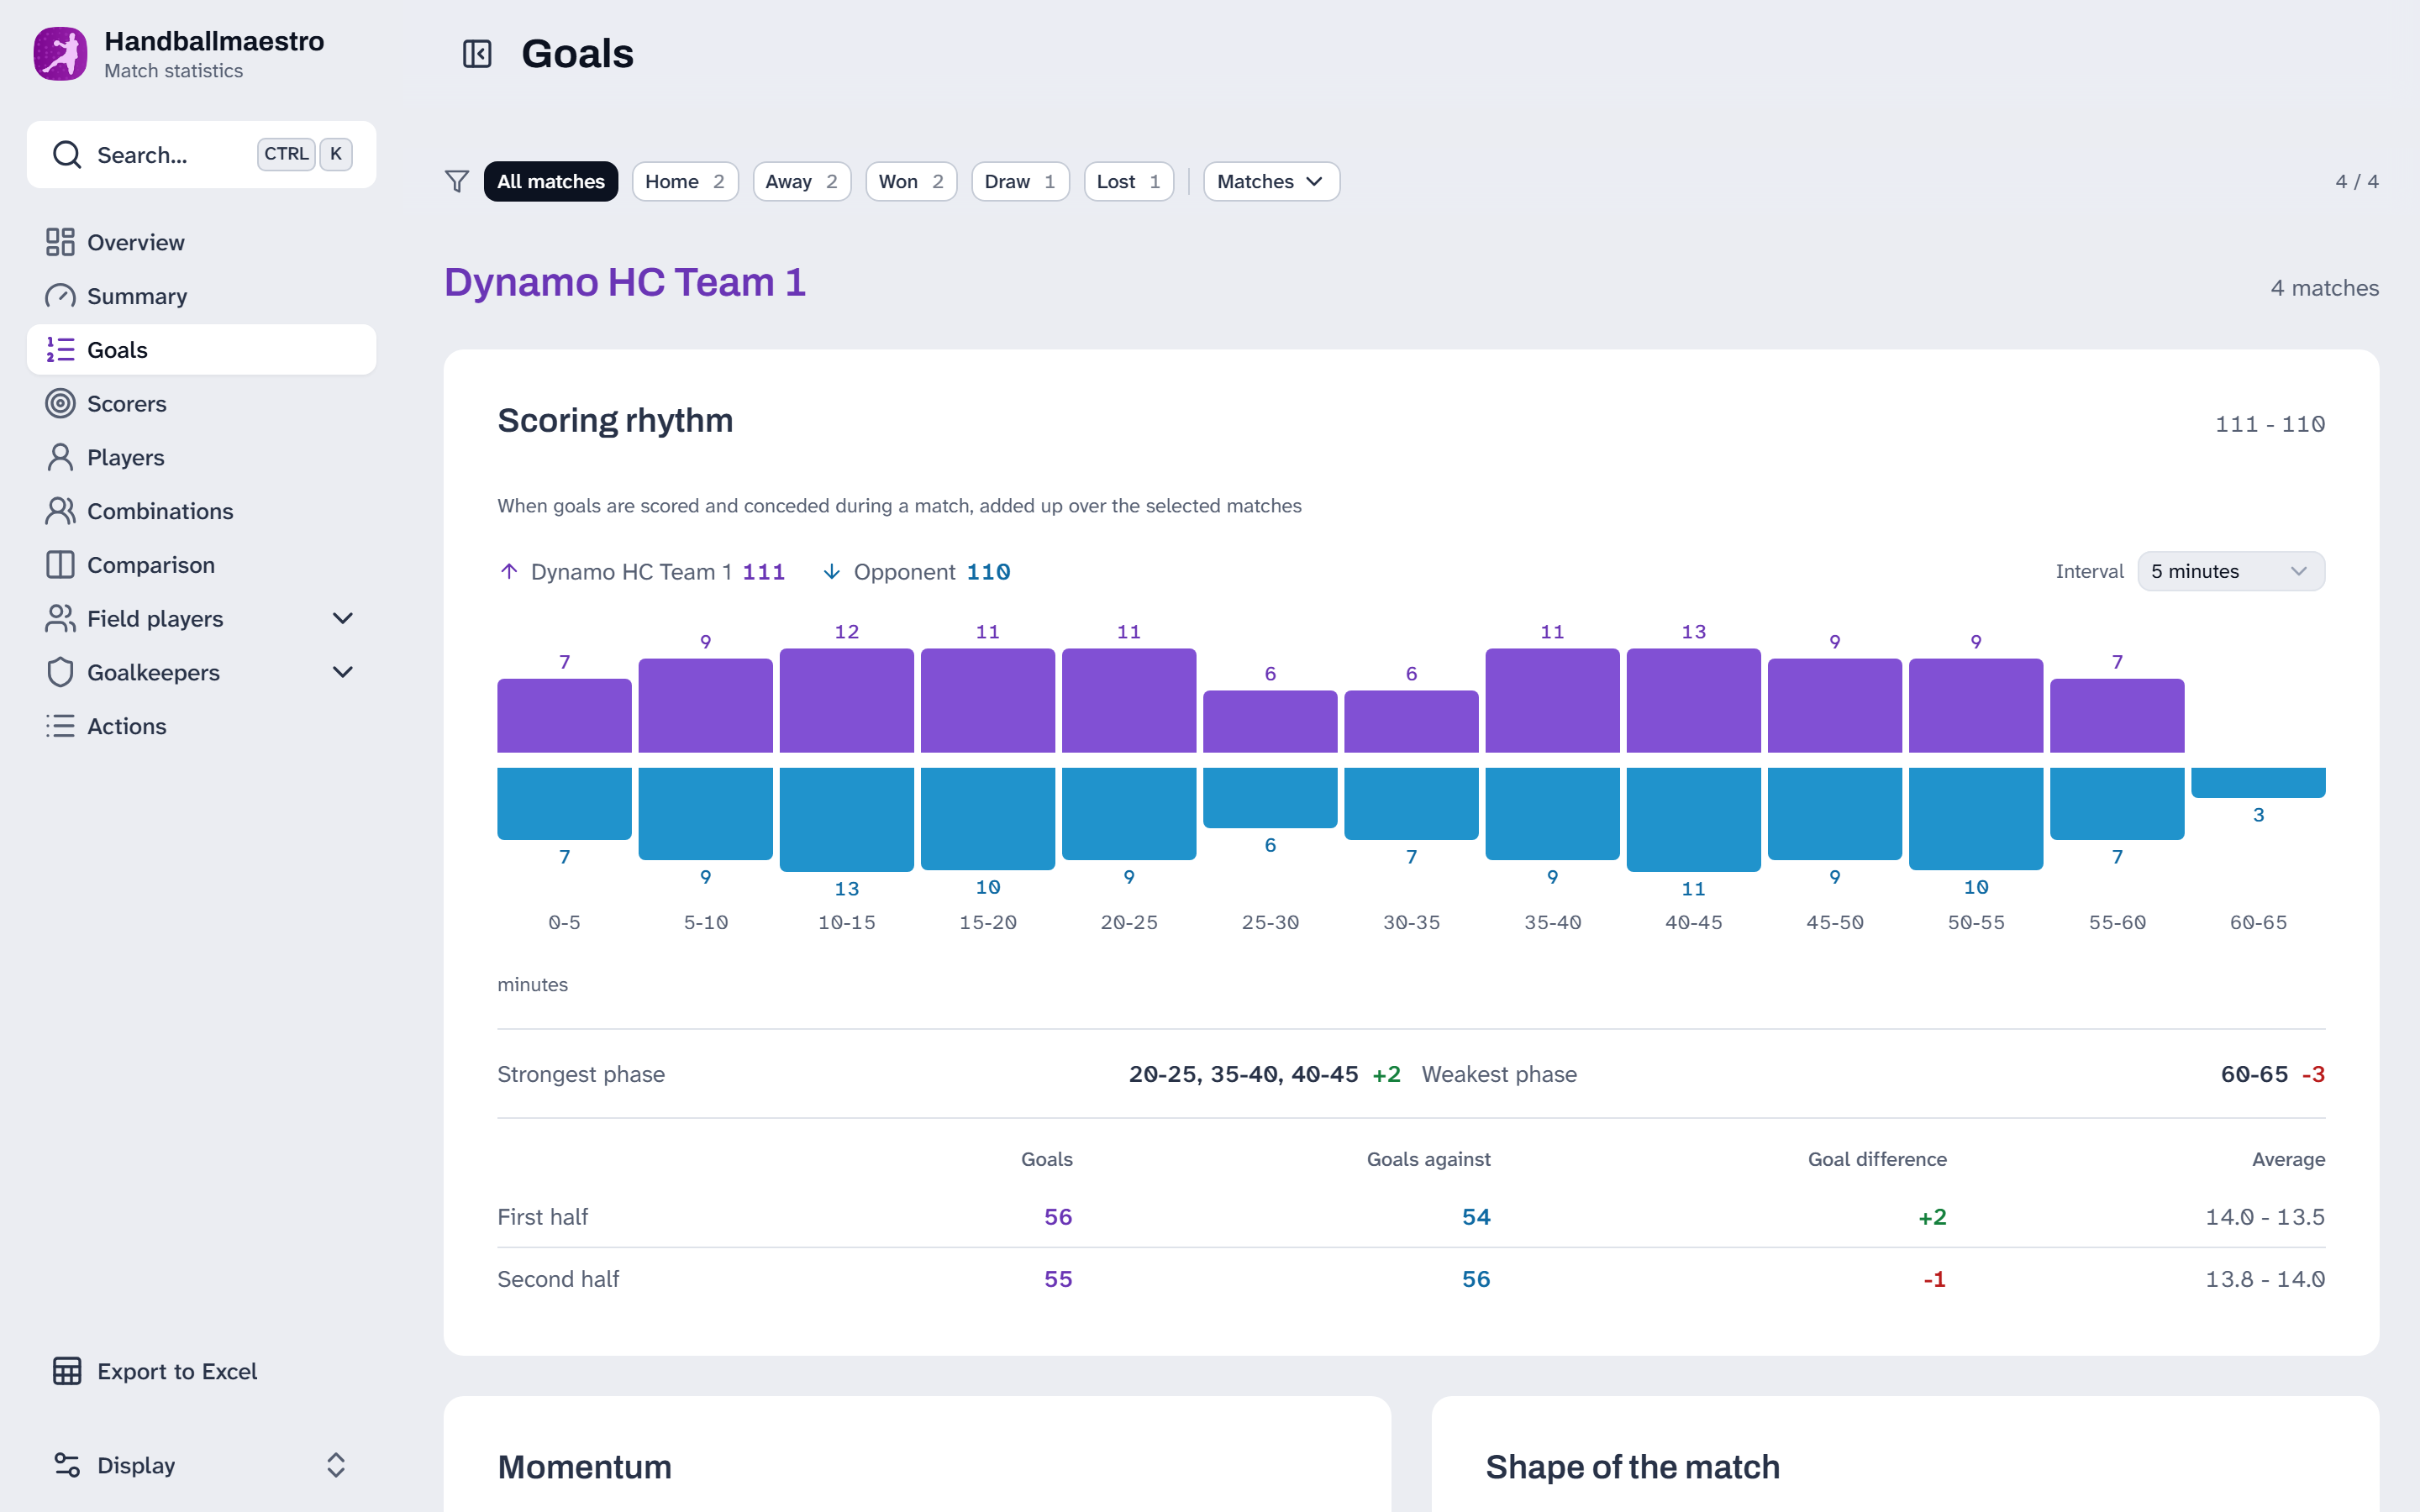
Goals adds up when you score and concede, in blocks of minutes you can set, and names the strongest and the weakest phase. Below it:
- Momentum: the longest run of goals for and against, and how often you score straight back after conceding.
- Shape of the match: how often you score first and what it brings, and how much of the playing time you spend ahead, level or behind.
- Playing with one more or one less: goals in the two minutes after a suspension, per ten minutes, so they compare with playing at equal strength.
Two parts side by side
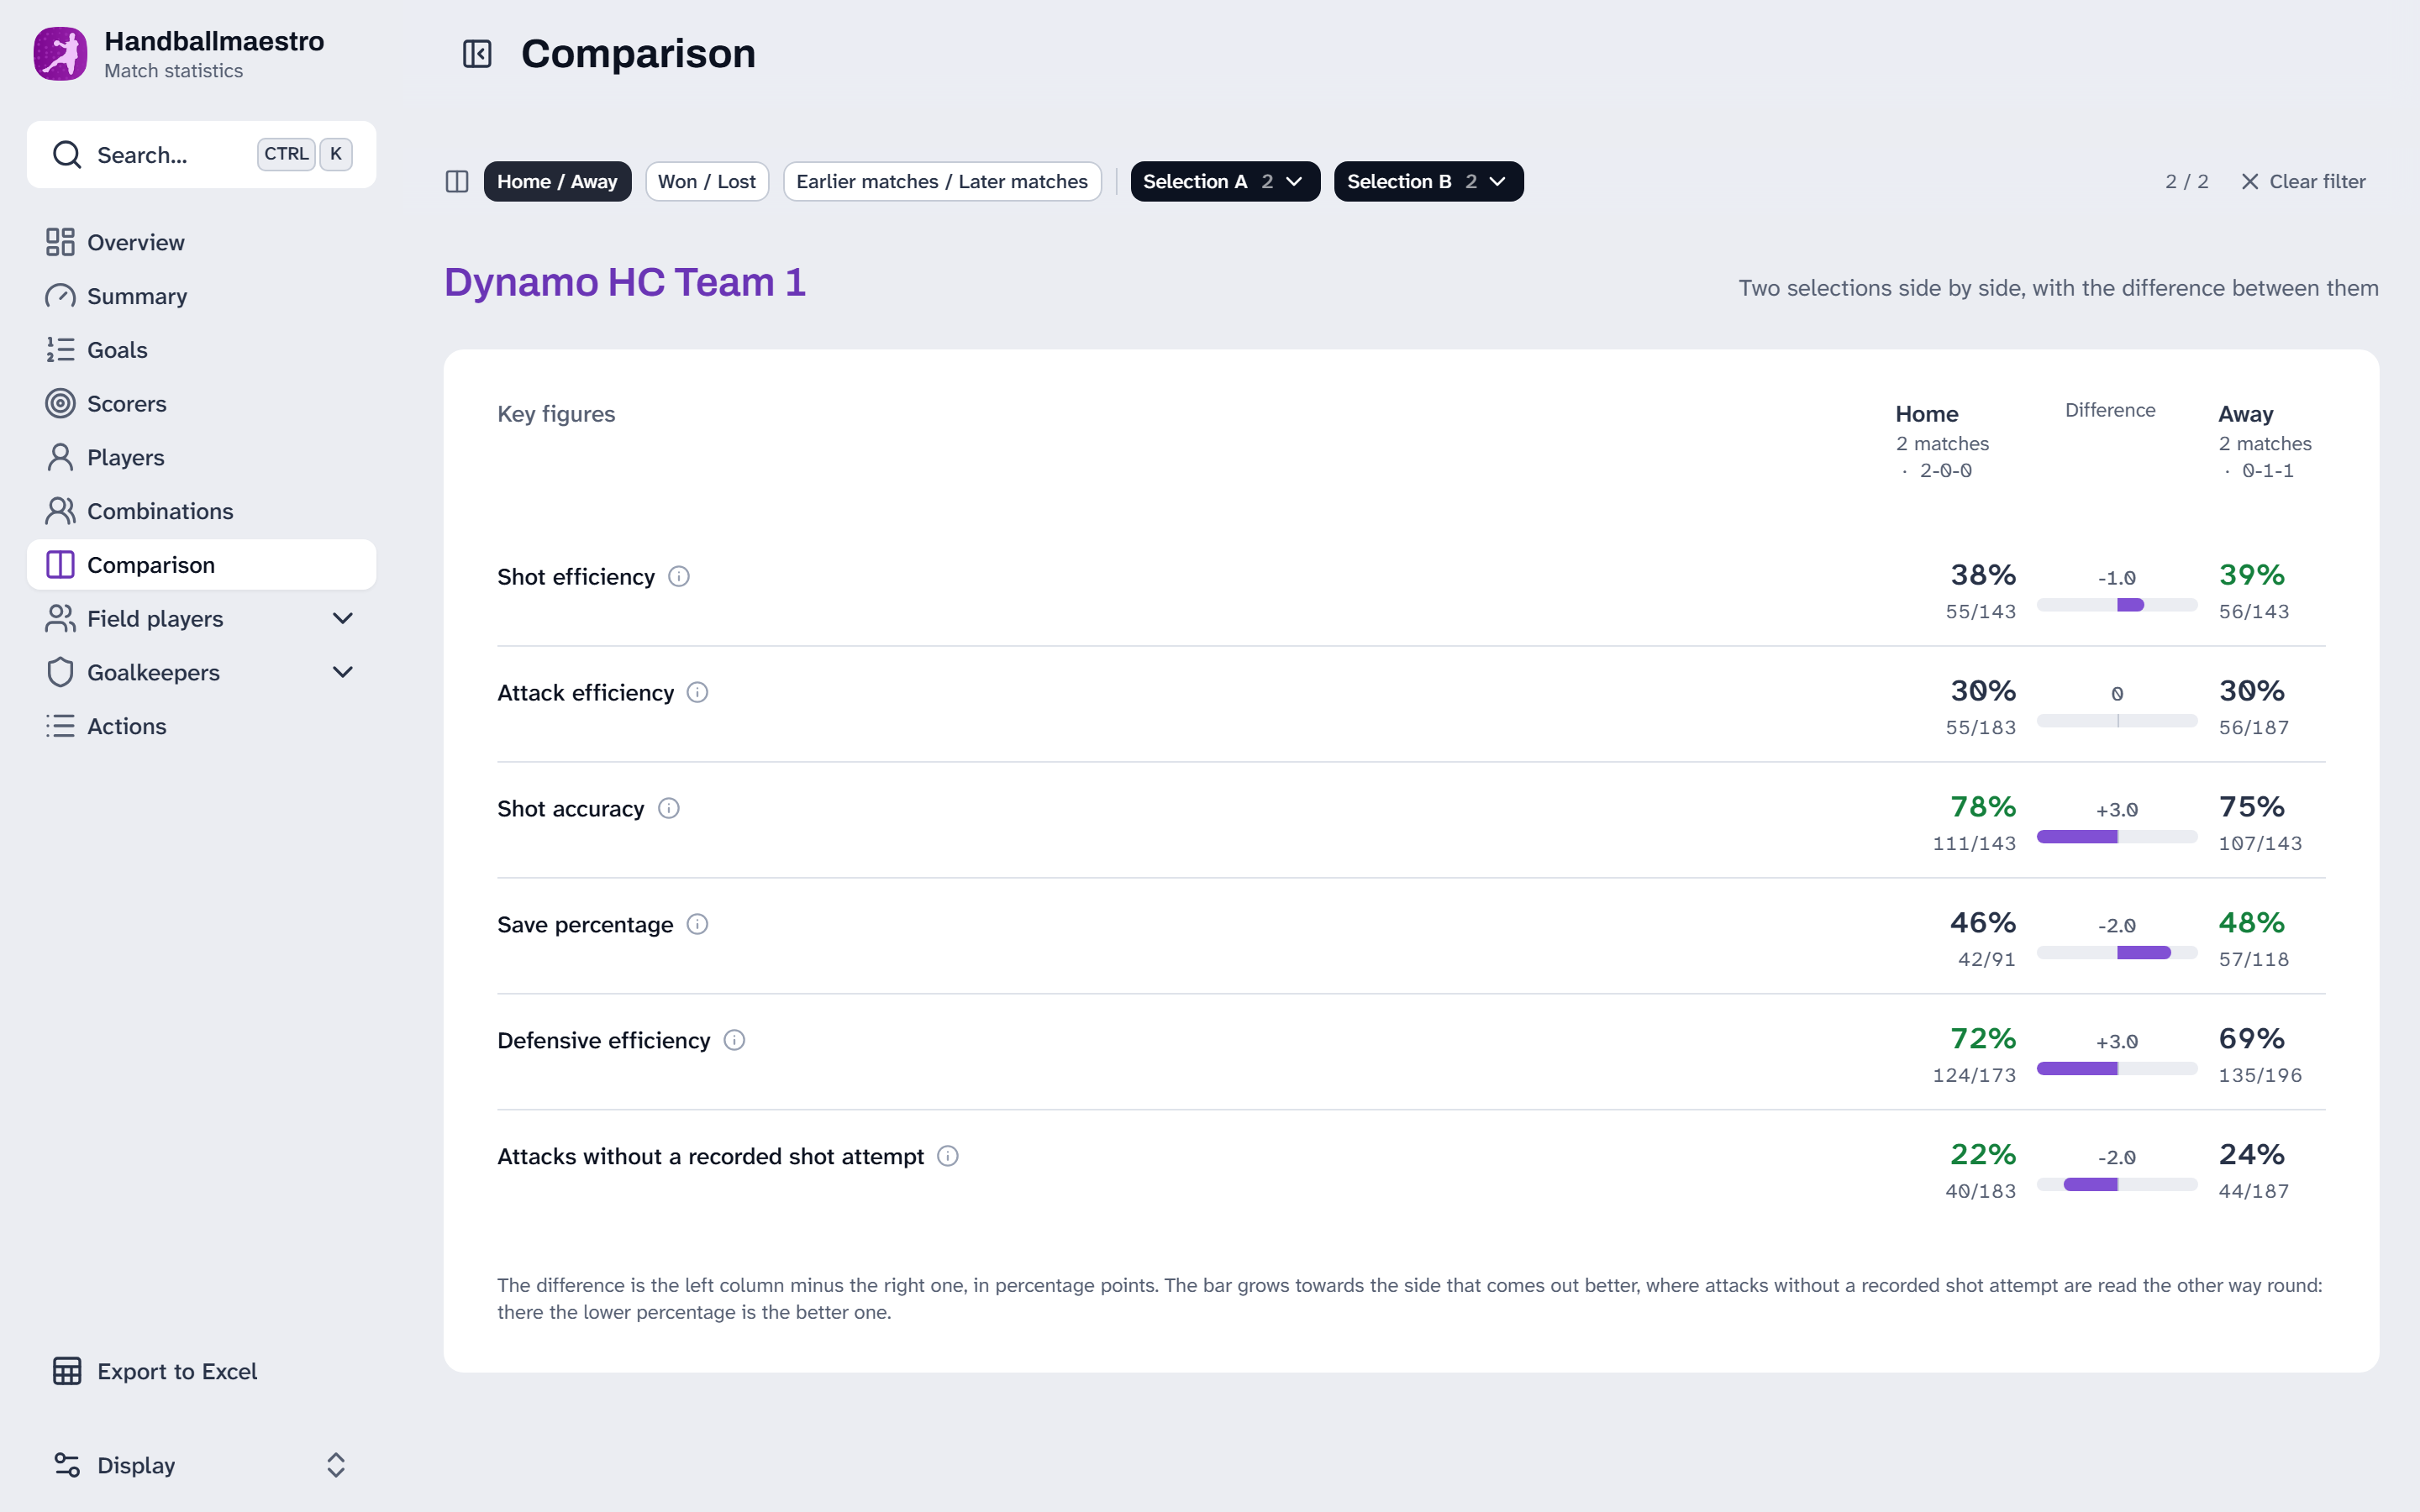
Comparison puts two parts of the selection next to each other. Home against away, won against lost, and the first matches against the last are one click each; you can also choose both sides yourself. Every key figure shows both percentages and the difference, with the bar growing towards the side that comes out better.
Every action
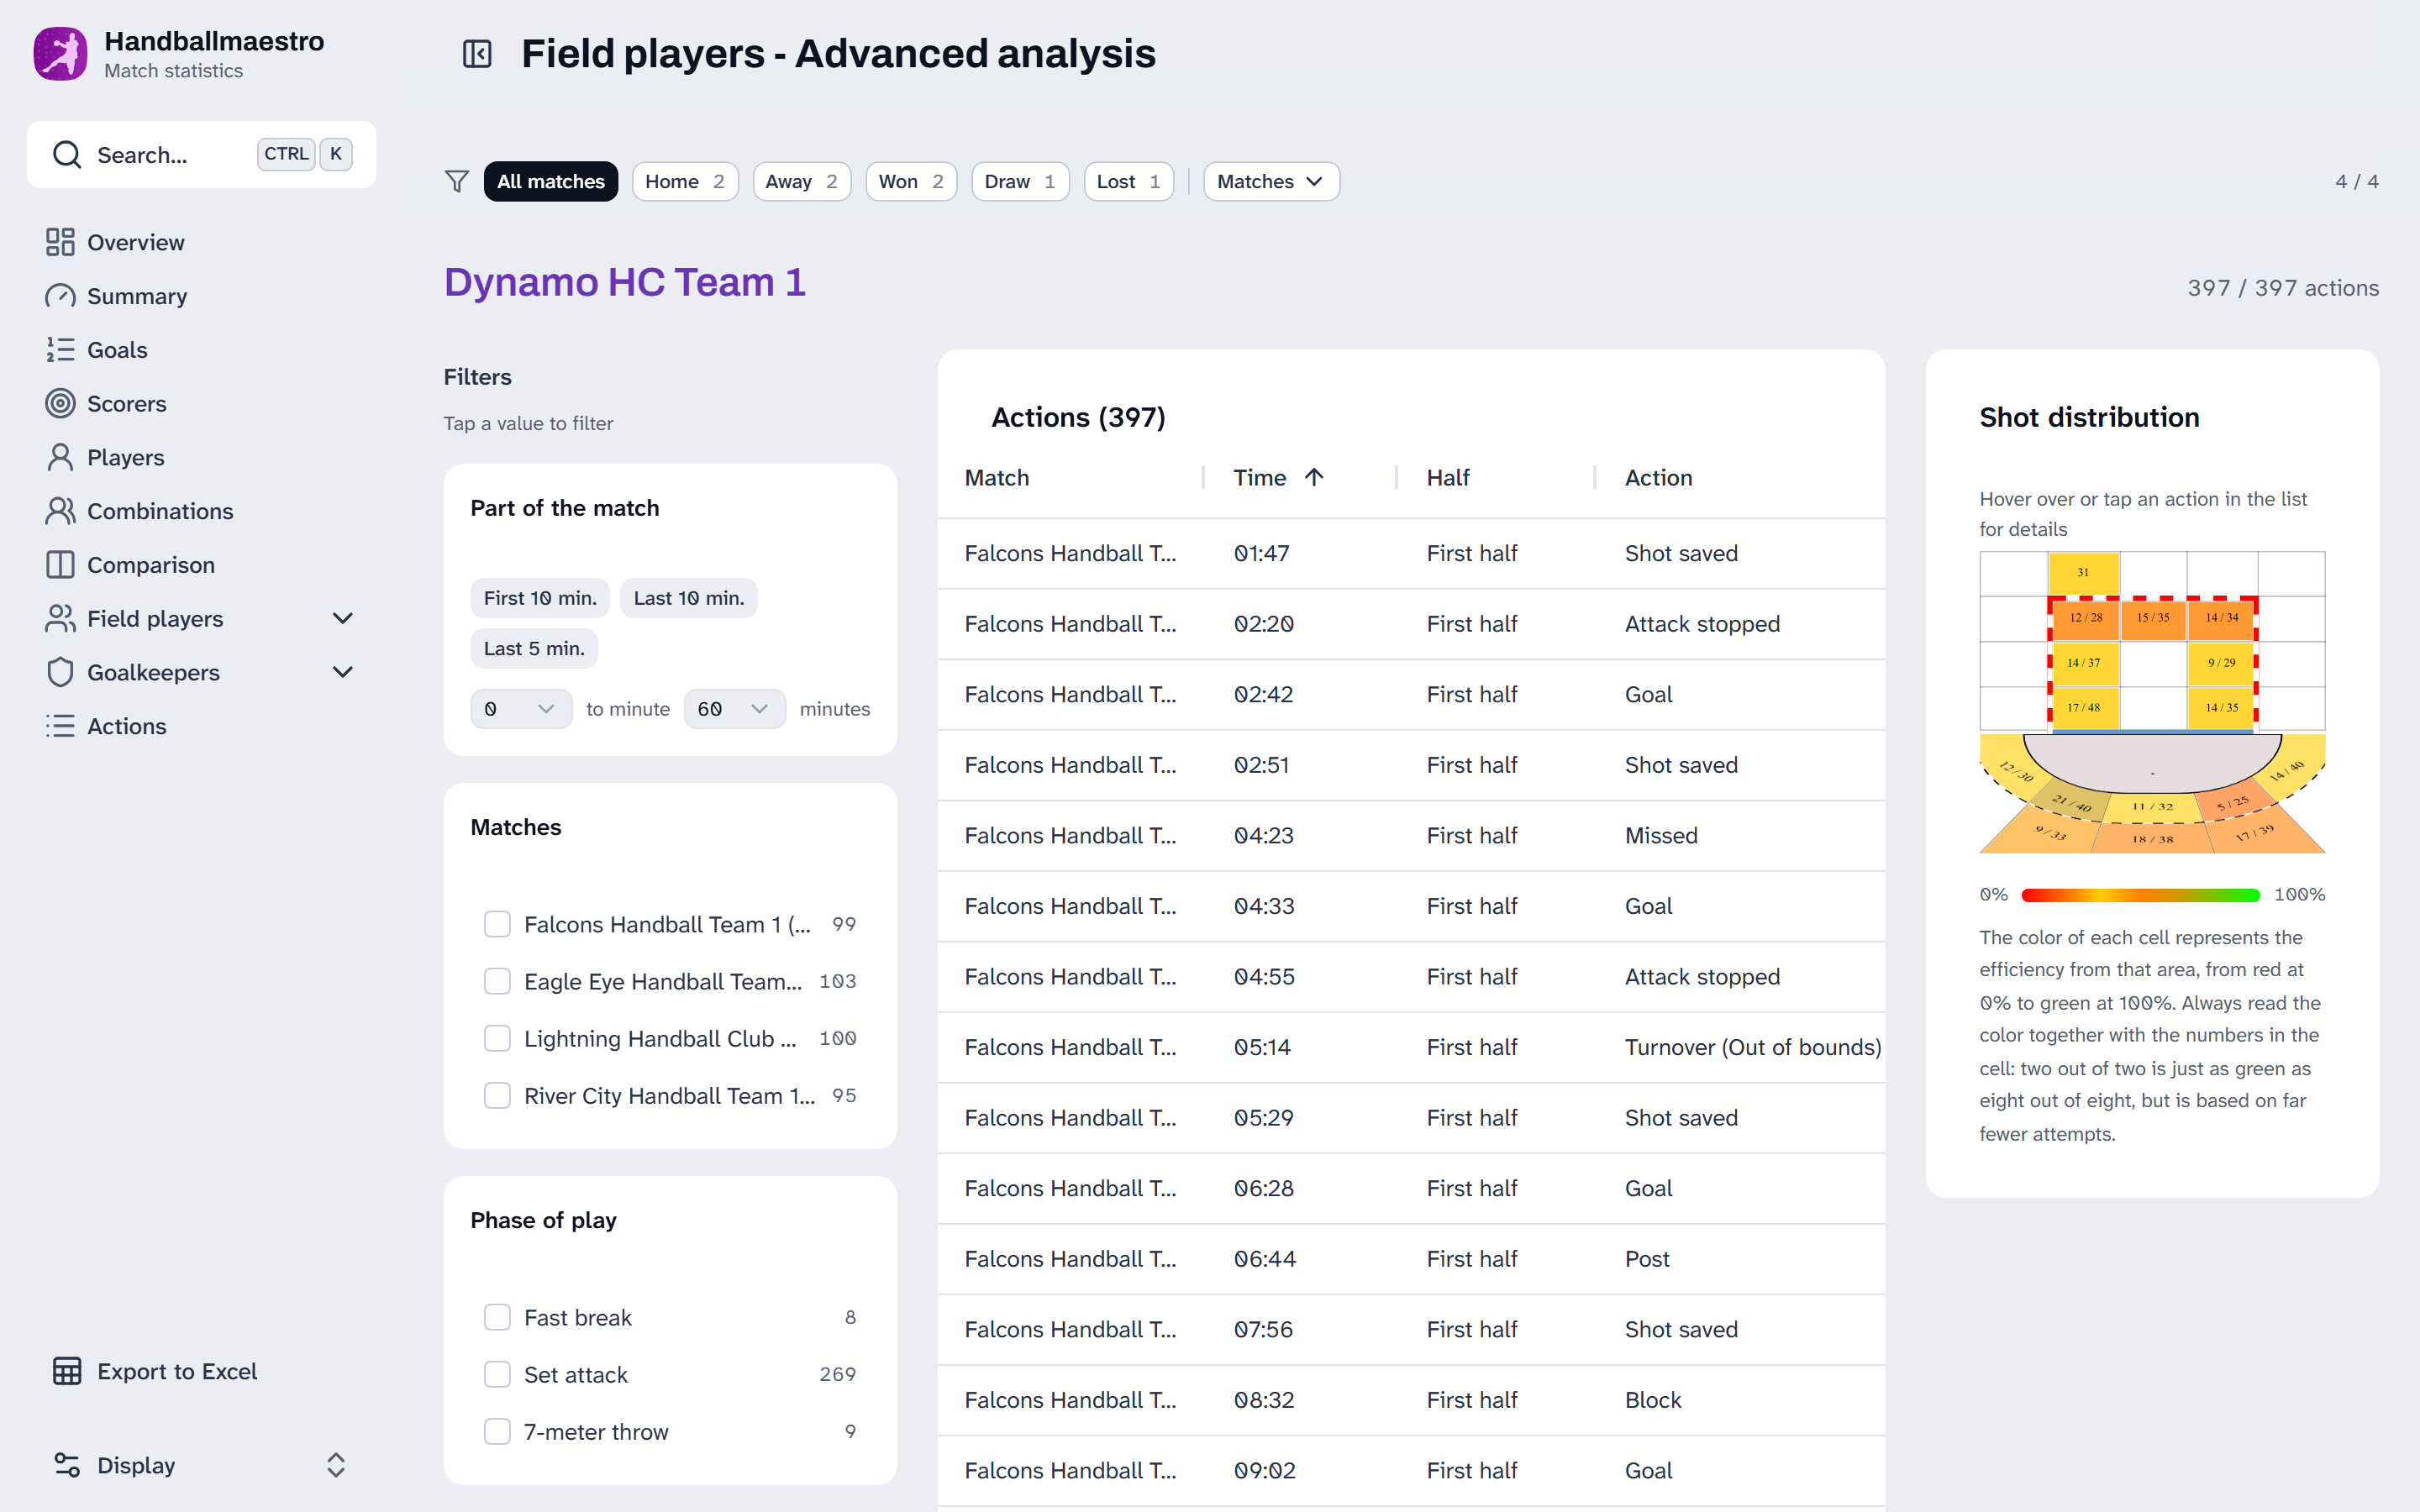
The advanced analysis lists every action of every match in the selection, and takes them apart by whatever you tap: the match, the phase of play, the kind of action, the player, the goalkeeper, the reason for a turnover, or a part of the match, such as the last ten minutes. The shot map next to it follows the filter, so you see where the shots came from that were lost late in matches.
Players
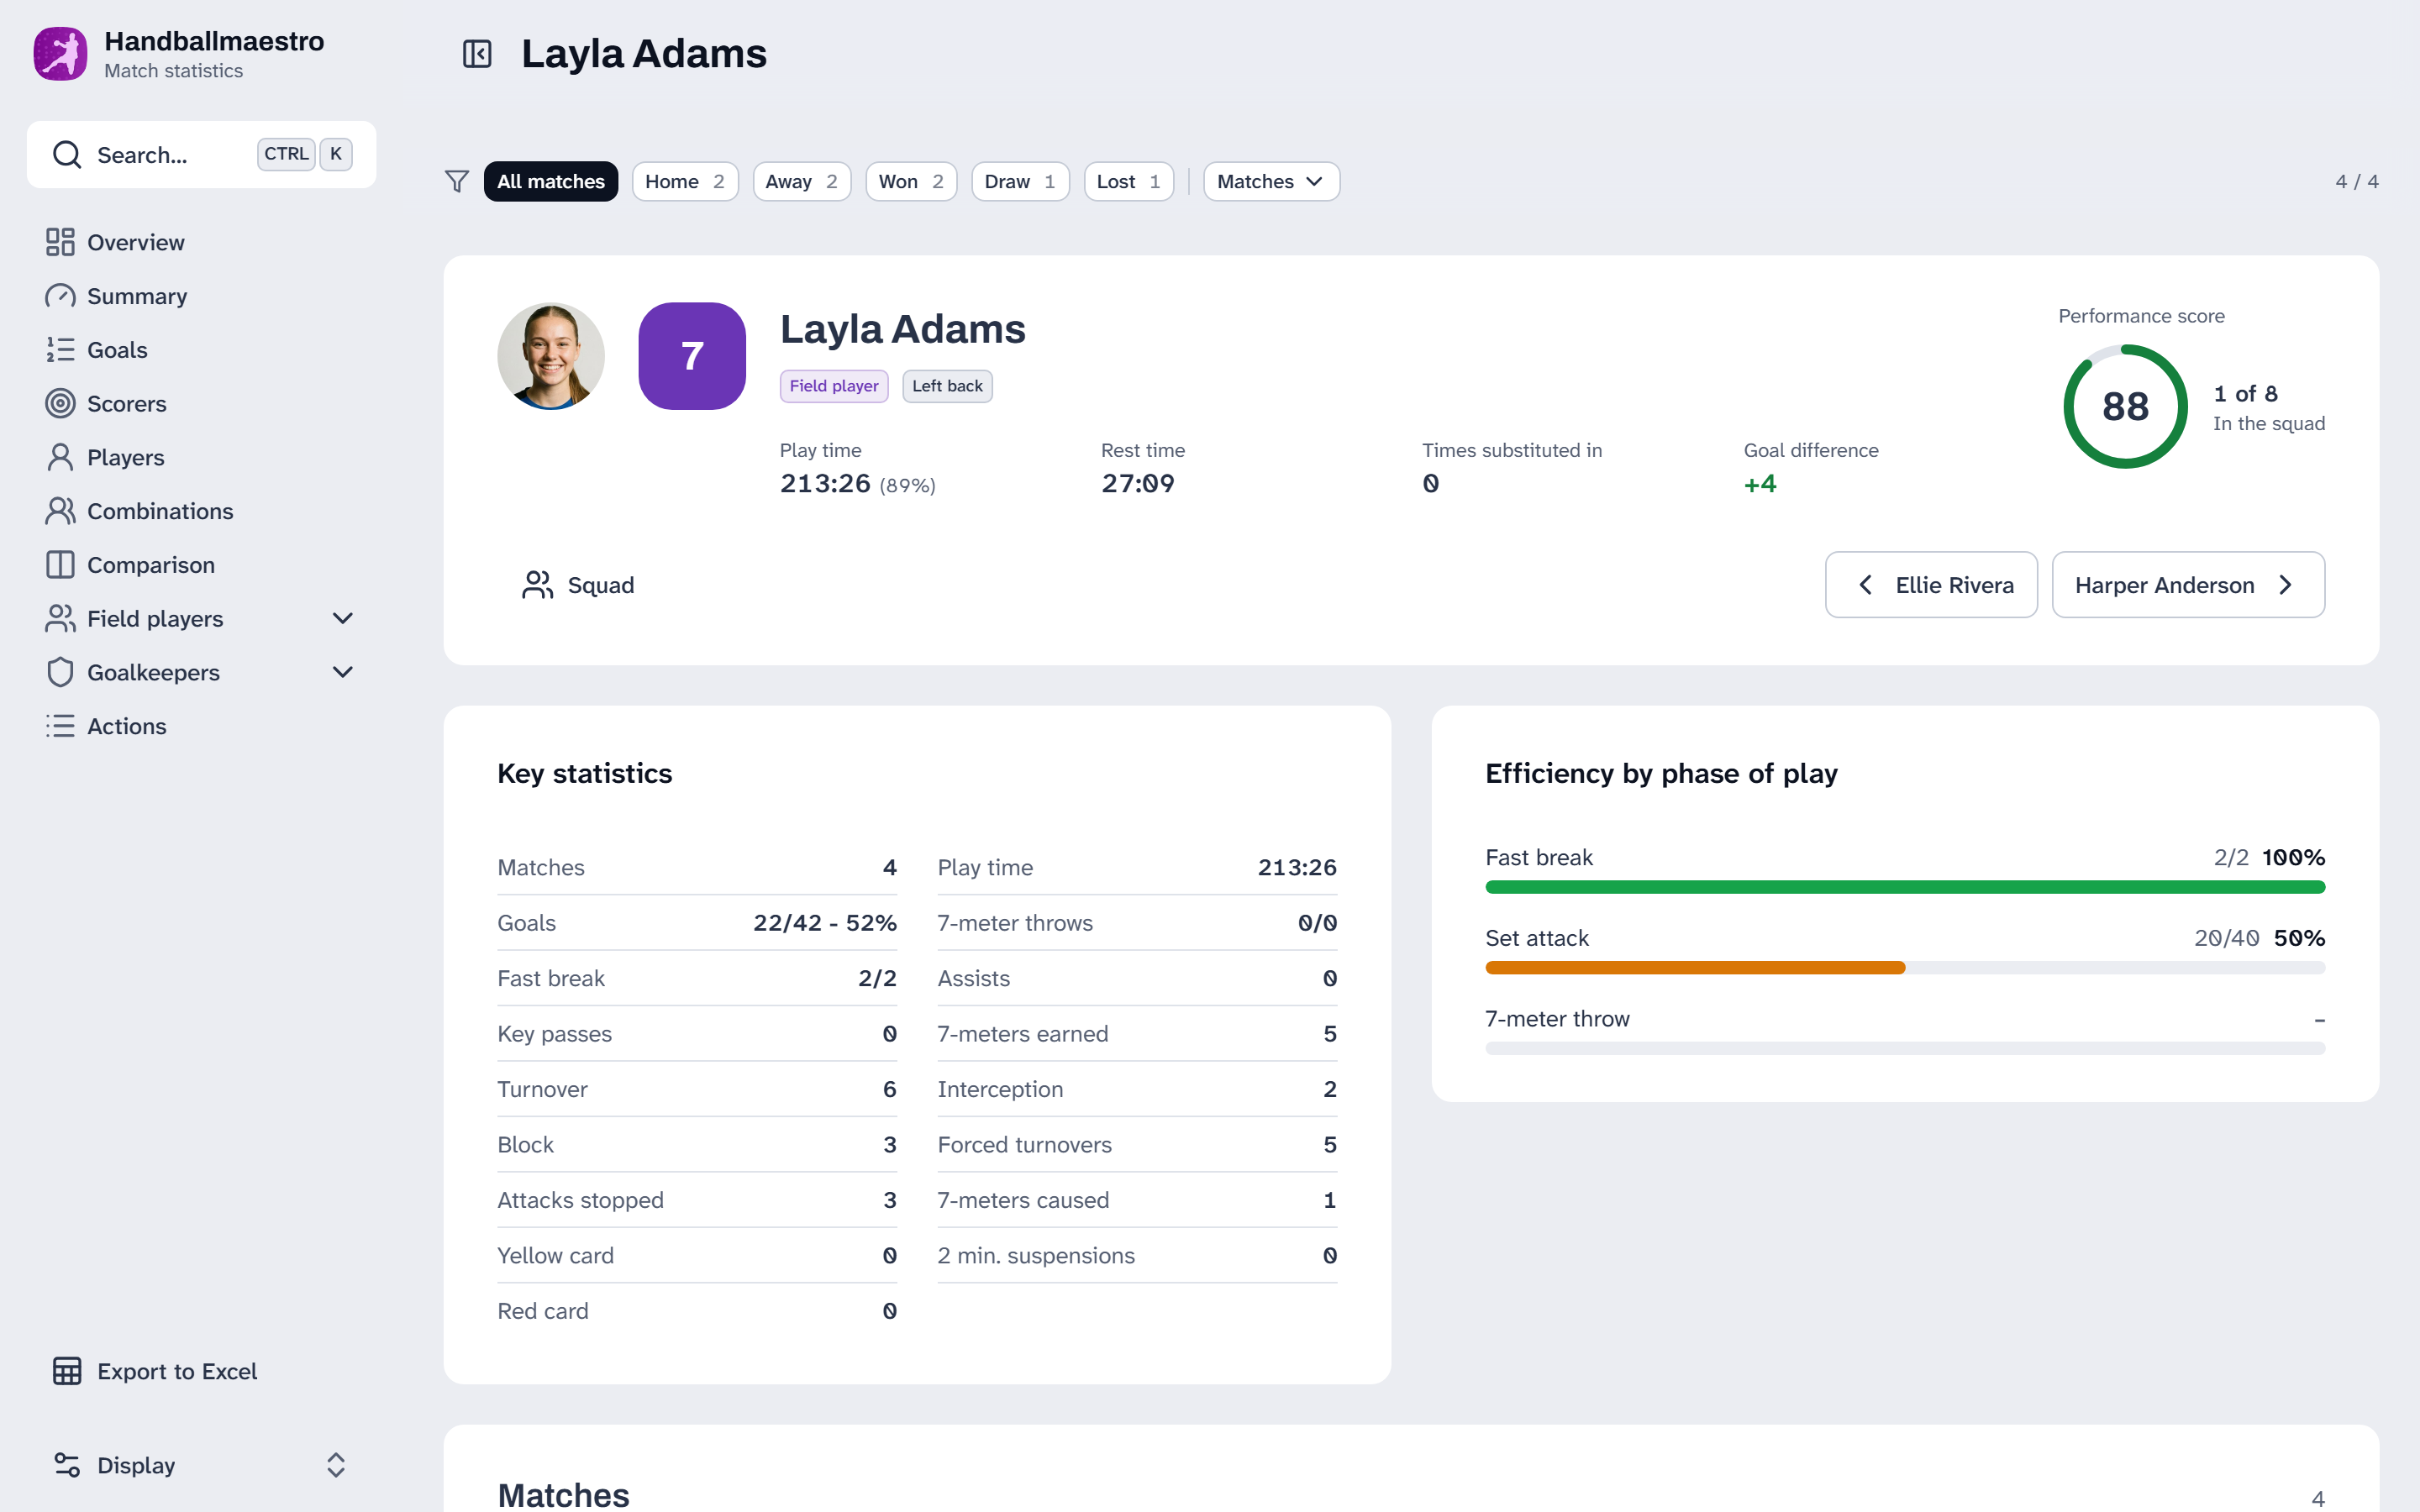
Players shows the whole squad over the selection, and every player has a page of their own: the key statistics, the efficiency per phase of play, the form match by match, and a performance score that places them in the squad. The arrows at the top go to the next and the previous player. The squad can also be sorted by best defender.
Two more pages look at players together. Combinations shows which pairs of players, and which line-ups that came back more than once, outscore the opponent, measured over the time they were on the court together. The action balance, further down the summary, sets what each player wins back against what they give away, per match, so a player with four matches is not read against one with fifteen.
Your opponents
The opponents your team keeps track of are on the website as well, with their players and notes and the statistics of every match against them, so you can prepare for the next one on a big screen. See Knowing your opponent.
Finding your way
Search, at the top of the side menu or with Ctrl+K, finds pages, players and matches by name. Export to Excel, at the bottom of the side menu, downloads the selection as a spreadsheet, with a sheet for the totals, for every player and goalkeeper, and for the matches. It contains exactly what the filter shows. Under Display you choose light or dark, the colors and the language.
What you need for what
| Base | Pro | Max | |
|---|---|---|---|
| The statistics website, for one match | ✓ | ||
| The statistics website, for a selection of matches | ✓ | ||
| Sharing a link to either | ✓ |